Introduction
Chondroblastoma was reported by Kolodny (1927) for the first time, and in 1942, by Jaffe and Lichtestein, it was introduced as an independent disease referred to as chondoblastoma. Chondroblastoma is a rare benign bone tumor consisting of approximately 1% of the entire bone tumors developing in the epiphysis of long bones. The most prevalent invasion area are lower extremities, and in the order of the femur, humerus and tibia. Chondroblastoma could be developed in any ages, nonetheless, it is prevalent in children and young adolescent between the age of 10 and 20 years, and it occurs more frequently in the male than the female (1). The patients generally present pains and edema, and if pathologic fractures are developed, severe symptoms may be present (1).
Occasionally, chondroblastoma invades the articular cavity, and although very rare, it may take invasive courses such as metastasis (2). Most metastatic lesions are similar to general chodroblastoma commonly detected histologically (3). Such metastatic lesions are developed after surgical resection in many cases, it metastasized in the lung primarily, and the metastasized lesions do not grow, or after the resection of pulmonary lesion, the patient survives sufficiently long in many cases (4-7).
The vertebra is a very rare primary site of chondroblastoma, and only less than 10 cases have been reported in literatures (8-10). Chondroblastoma of which primary site is the vertebra and metastasized has not been reported yet.
We experienced one case of vertebral chondoblastoma accompanying lung metastasis in an adult male, and thus we report the case. In histological examination, both primary site and the metastasized site showed the typical chondroblastoma pattern.
Case Report
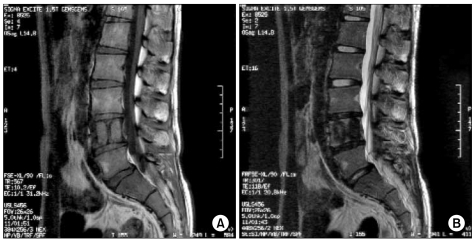
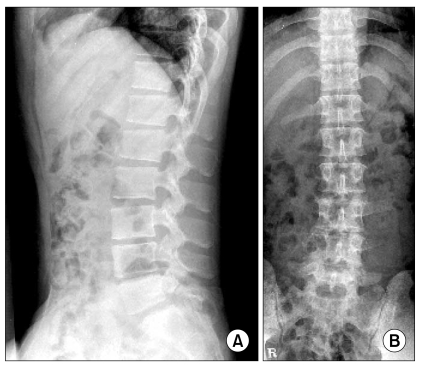
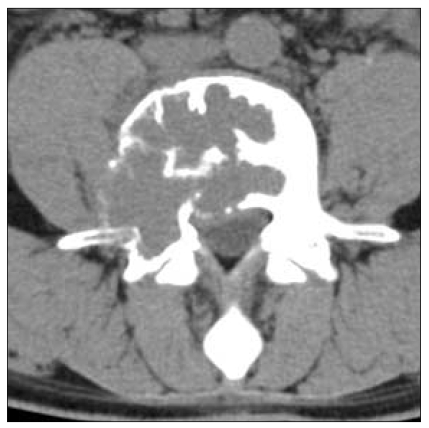
A 21 years old male patient visited our hospital for lumbago persistent for 6 months. During the army service, he developed lumbago, L-spine MRI was performed, and a tumor was detected in the L4 (Fig. 1), and thus he was transferred to our hospital. The patient did not show specific results in laboratory tests and neurological examination, and among radiological results, on lumbar vertebral X-ray, osteolytic findings in the 4th lumbar vertebra were detected (Fig. 2), and also in lumbar CT, a tumor suspected to be a primary bone tumor was detected (Fig. 3). To assess the property of tumor, CT-guided bone biopsy was performed.
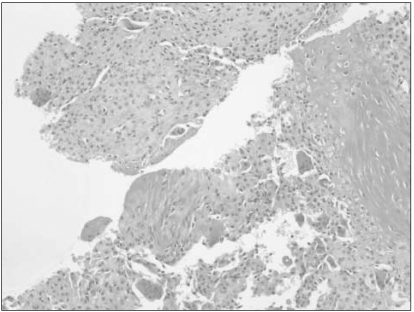
The result of biopsy shows relatively undifferentiated hypercellular tissues consisting of cells with round or polygonal chondroblast shape as well as the presence of the cartilaginous interstitium, which was findings satisfying chodroblastoma. S-100 protein was detected to be equivocal (Fig. 4). On PET CT performed to assess its metastasis status, nodules with increased FDG uptake in both lower lobes of the lung were detected (Fig. 5). To block feeding vessels, we performed embolization on the RT 4th lumbar artery twice, and on angiography taken after embolization, the reduction of the staining of tumors was confirmed. Afterward, total laminectomy of L4, the primary site, was performed, the patient recovered after the surgery, and transferred to the department of thoracic surgery for pulmonary biopsy, and by performing wedge resection applying Video-Assisted Thoracic Surgery, biopsy results fitting with chondroblastoma identical to the primary site were obtained.
The patient is discharged and under 3 years follow up observation by PET CT, lumbar MRI, etc. and the further growth of tumors has not been observed.
Discussion
Chondroblastoma is a rare benign cartilaginous bone tumor consisting of 1% of the entire bone tumors, and the average onset age is 10~20 years. Chondroblastoma is formed by chodroblast that is primitive cells of the epiphyseal cartilaginous lamina, and because of it, it is developed frequently in the epiphysis of long bones, and although rare, it is developed in small tubular bone of upper and lower extremities in some cases (11,12). On X-ray, together with metaphyseal distension and sclerotic margin, the result of the osteolysis of the epiphysis of long bones may be shown. On T1-weighted image of MRI, it appears as low signal intensities, and on T2-weigthed image, it appease as diverse signal intensities. Some low signal intensities detected on T2-weighted images are associated with the volume of immature cartilaginous stroma and the cellularity of chondroblasts. On T2-weighted images, it is required to differentiate from enchondroma, osteochondroma, and well-differentiated osteosarcoma that show high signal intensities, clear cell chondrosarcoma shows characteristics similar to chondroblastomas and shows diverse signal intensities on T2-weighted images, and thus it may be difficult to differentiate from them (13). Histological results show relatively undifferentiated hypercellular tissues with round or polygonal cartilaginous interstitium, and histological results were identical regardless of metastasis (7). In addition, rare histological results such as mitotic activity, necrosis, cellular atypia, were observed. However, regardless of such specificity, the course of all diseases was benign with limited local aggressiveness, however, postsurgical local recurrence was reported in some cases. In regard to the metastasis of chondroblastoma, it was investigated by Kunze et al. (3), and in their study, metastatic chondroblastoma was observed in all 7 patients, and among them, even multiple lung metastasis patients were included. The period from the diagnosis of primary tumor to the detection of lung metastasis was average 8.4 years, which is a relatively long time, and their average survival time was 12.3 years. The period from the detection of metastasis to death was average 6.3 years (14). It has been reported that the pathological result of metastatic chondroblastoma is not different from general chondroblastoma, and it is impossible to predict the status of metastasis by pathological findings. Nonetheless, it has been reported that in cases detected tumor emboli in the primary site, the possibility to metastasize is high (14). For cases that tumor emboli are detected, the size of primary tumor is big, developed in flat bones, or invaded soft tissues, aggressive surgical approach is required, and even in cases detected lung metastasis, for good prognosis and complete cure, surgical resection in the metastasized area has been recommended (14). In our case, primary chodroblastoma was detected in the lumbar vertebra, on PET-CT taken to assess metastasis, pulmonary nodules showing FDG uptake were detected, and thus after performing spinal surgery, lung resection was performed simultaneously.