Introduction
Anaplastic gliomas, which account for 15%-20% of malignant gliomas [1], have poor prognosis despite modern multimodal treatments. To improve the accuracy of diagnosis and treatment, the 2016 World Health Organization (WHO) classification changed the three original categories from the 2007 classification, namely anaplastic astrocytoma, anaplastic oligodendroglioma, and anaplastic oligoastrocytoma. These three categories were further subdivided as follows: anaplastic astrocytoma, isocitrate dehydrogenase (IDH)-mutant (AAm); anaplastic astrocytoma, IDH-wildtype (AAw); anaplastic astrocytoma, not otherwise specified (NOS); anaplastic oligodendroglioma, IDH-mutant and 1p/19q-codeleted (AOmc); anaplastic oligodendroglioma, NOS; and anaplastic oligoastrocytoma, NOS [2]. We obtained survival rates according to the new classification and examined the associated prognostic factors.
Extent of resection (EOR) has been known as an important prognosticator in anaplastic gliomas [3,4]. However, many studies have focused on only the contrast-enhanced parts of tumors observed in T1-weighted magnetic resonance imaging (MRI), despite many cases of anaplastic gliomas that are not enhanced or are only partially enhanced in contrast-enhanced T1-weighted images. In the present study, we investigated the tumor volume and EOR in both contrast-enhanced T1-weighted MRI and T2-weighted MRI sequences.
The aims of this study were (1) to identify the survival rate and prognostic factors in patients with anaplastic gliomas in the 2016 WHO classification; (2) to determine whether the volumetric measurement of EOR has prognostic value in contrast-enhanced T1-weighted MRI and T2-weighted MRI, and (3) to determine the prognostically meaningful cut-off value of resection volume in each MRI sequence.
Materials and Methods
1. Patient selection
We performed a retrospective analysis of the medical records and MRI features of 113 consecutive patients with anaplastic glioma who were newly diagnosed at our institute between 2000 and 2013, with neither prior radiotherapy nor chemotherapy. We excluded patients with gliomatosis cerebri (involving more than three lobes), midline location, and malignant transformation of a previously operated low-grade glioma. The medical records reviewed included sex, age at first diagnosis, preoperative Karnofsky Performance Scale (KPS) score, and postoperative treatment (radiotherapy, chemotherapy) (Table 1).
2. Histopathologic review
We investigated the molecular profiles of all patients including 1p/19q codeletion status, methylation of the O6-methylguanine-DNA methyltransferase (MGMT) promoter and the state of IDH mutation. The IDH mutation status was initially assessed using immunostaining for the IDH1-R132H mutation. If immunohistochemistry did not show a mutation in IDH1-R132H, sequencing of IDH1 codon 123 and IDH2 codon 172 was performed. The 113 cases (grade III glioma based on the 2007 classification) were re-classified using the 2016 classification system: cases with wild-type IDH were classified as AAw, cases with non-codeleted 1p/19q and mutated IDH were classified as AAm, and cases with an IDH mutation and 1p/19q codeletion were classified as AOmc. This re-classification identified 62 cases of AAw, 18 cases of AAm, and 33 cases of AOmc. All pathological and molecular data were reviewed by a single pathologist (S.H.K.).
3. Imaging evaluation
MRI sequences, including T2-weighted, fluid-attenuated inversion recovery (FLAIR) and contrast-enhanced T1-weighted, were obtained preoperatively, postoperatively, and at regular follow-ups. Two experienced radiologists reviewed all patients’ MRI data. Manual segmentation was performed to measure the tumor and resection volumes. We used OsiriX software (Pixmeo SARL, Bernex, Switzerland) to measure tumor volumes and EOR. Tumor volume was estimated based on the area of increased signal intensity on the contrast-enhanced T1-weighted images (enhancing lesions) or T2-weighted images (non-enhancing lesions). We tried to exclude any regions with cerebral edema on the T2-weighted images. The non-enhancing tumor was defined with regions of T2 hyperintensity (less than cerebrospinal fluid signal) that were associated with mass effect and architectural distortion, including blurring of the gray matter/white matter interface. Edema needed to be greater in signal than the non-enhancing tumor and lower than the cerebrospinal fluid on T2. The resection extent was calculated using early postoperative images (< 48 hours). EOR was calculated with the following equation: (preoperative tumor volume–postoperative tumor volume)/preoperative tumor volume. With respect to tumor location, deep lesions were defined as those that involved the brainstem, thalamus, basal ganglia, and the insula; superficial lesions involved only the cortex outside the insula.
4. Statistical analyses
We analyzed overall survival (OS) and progression-free survival (PFS) according to the specific pathology type using Kaplan-Meier curves and log-rank tests. To identify factors associated with PFS and OS, univariate and a multivariate Cox proportional regression analyses with stepwise methods (entry and exit criteria of p < 0.05) were performed, using the time from surgery to progression or death. Age, preoperative KPS score, tumor volume, and EOR were evaluated as continuous variables. OS was defined as the time from surgery to death from any cause or the last follow-up. PFS was defined as the time from surgery to the first instance of radiological signs of progression and/or deteriorated neurological status or death. We estimated optimal cut-off values for the dichotomization of the clinical outcome variable based on time-to-event data using the technique devised by Contal and O’Quigley [5]. The optimal cut-off point was selected by maximizing the hazard ratio. p-value < 0.05 was considered statistically significant. All statistical procedures were performed using SAS for Windows ver. 9.4 (SAS Institute Inc., Cary, NC).
5. Ethical statement
All methods were performed in accordance with the ethical guidelines of the 1975 Deceleration of Helsinki, as revised in 1983, and was approved by the institutional review board of Severance Hospital (Yonsei University Health System, Severance Hospital, 4-2019-0181). The written informed consent was waived by the institutional review board that approved this study’s protocol because all the information was tabulated in anonymized and de-identified fashion.
Results
1. Patient characteristics
The clinical information of all 113 patients are listed in Table 1, stratified by the 2016 WHO classification. There were 62 patients (54.9%) in the AAw group, 18 (16.0%) in the AAm group, and 33 (29.2%) in the AOmc group. The median age at first diagnosis in the whole cohort was 40 years (range, 18 to 82 years). In total, 102 patients (90.3%) received postoperative radiotherapy and 59 (52.2%) received chemotherapy. Among the chemotherapy regimens, 15 cases (13.3%) were treated with PCV (procarbazine, lomustine, and vincristine) and 41 (36.3%) with temozolomide. The postoperative treatment modalities are also presented in Table 1. MGMT promoter methylation was detected in 64 cases (56.6%) of the whole cohort, 20 cases (17.7%) in the AAw subgroup, 15 cases (13.3%) in the AAm subgroup, and 29 cases (25.7%) in the AOmc subgroup.
2. Volumetric analysis
The mean tumor volumes in the contrast-enhanced T1-weighted and T2-weighted MRI sequences were respectively 13.8 cm3 (range, 0.0 to 117.8 cm3) and 51.6 cm3 (range, 0.8 to 232.9 cm3) preoperatively, and 1.0 cm3 (range, 0.0 to 24.4 cm3) and 9.9 cm3 (range, 0.0 to 166.5 cm3) postoperatively. The EOR measured in contrast-enhanced T1-weighted MRI (EOR-T1CE) was 90.6% (range, 0% to 100%), while it was 87.4% (0.0%-100%) in the T2-weighted MRI sequence. In our study biopsies were performed in 25 patients (22.1%).
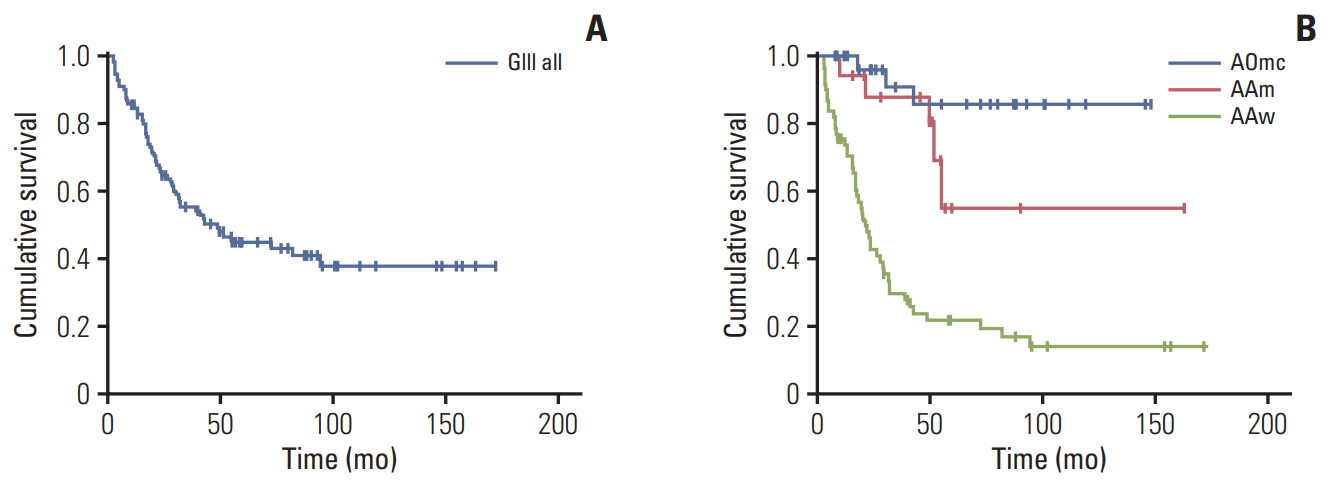
3. Survival
After a median follow-up period of 66.1 months, the median OS was 48.4 months (95% confidence interval [CI], 15.1 to 81.7) for all patients and 21.5 months (95% CI, 17.2 to 25.8) in the AAw subgroup (Table 2, Fig. 1). The median OS was not reached in the other subgroups since more than half of the patients were still alive at the last follow-up. OS values for years 1-5 are presented in Table 2. PFS was 31.8 months (95% CI, 17.6 to 46.2) for all patients, 16.4 months (95% CI, 12.6 to 21.0) in the AAw subgroup, and 130.0 months (95% CI, 0.0 to 269.8) in the AOmc subgroup (Table 2, Fig. 2). PFS values for years 1-5 are presented in Table 2.
4. Prognostic factors
In univariate analysis, age, preoperative KPS score, tumor location, MGMT methylation status, postoperative residual tumor volume measured in contrast-enhanced T1-weighted MRI (RTV-T1CE), postoperative residual tumor volume measured in T2-weighted MRI (RTV-T2), EOR-T1CE, and EOR measured in T2-weighted MRI (EOR-T2) were statistically significant prognostic factors for OS and PFS (Table 3).
In the multivariate analysis, age, preoperative KPS, MGMT methylation status, RTV-T1CE, RTV-T2 and EOR-T2 were also statistically significant prognostic factor for OS, while age, MGMT methylation status, RTV-T1CE, RTV-T2, and EOR-T2 were statistically significant prognostic factors for PFS (Table 4).
5. Cut-off value of EOR
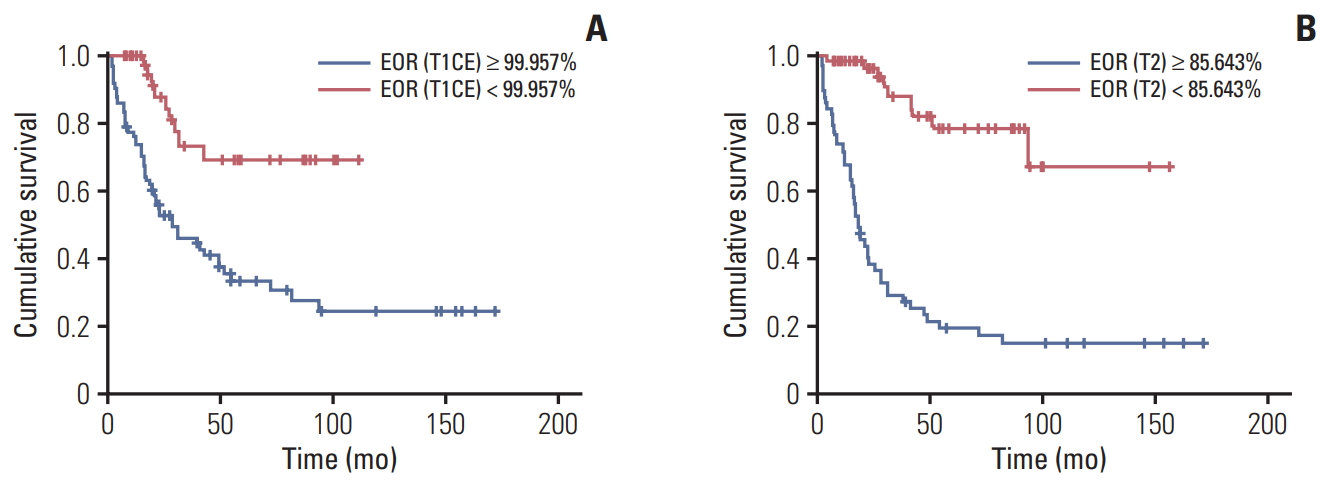
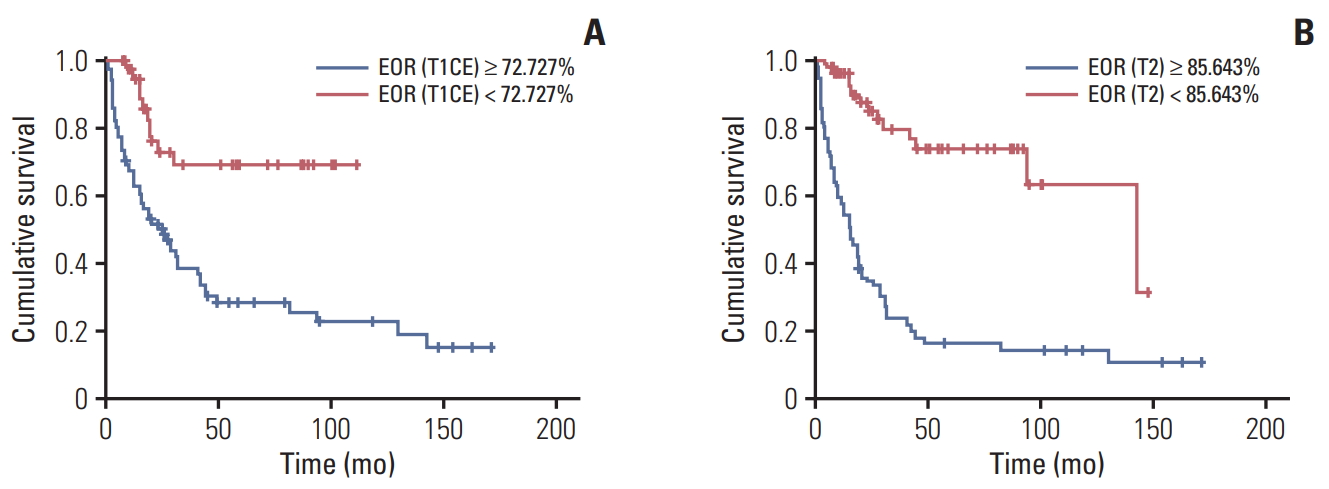
In cut-off value analysis using the Contal and O’Quigley method, age < 51 years, complete resection of the enhanced portion (99.96%), and more than 85.64% resection of the non-enhanced tumor portion showed prognostic impacts on OS in patients with anaplastic gliomas (Table 5, Fig. 3). As for PFS, age < 55 years, 72.73% resection of the contrast-enhanced portion, and 84.88% resection of the non-enhanced tumor portion demonstrated prognostic impacts (Table 5, Fig. 4).
Discussion
Despite multimodal treatment with surgery, radiotherapy, and chemotherapy, the prognosis for anaplastic glioma is poor. Several reports published in the past decade have shown survival times ranging from 19 months to 14.7 years for anaplastic gliomas [3,4,6-11]. Because of these varied prognoses, a new WHO 2016 classification, based on molecular markers, has been developed to promote more detailed and accurate diagnosis. Our study of 113 patients with anaplastic gliomas analyzed the survival, prognostic factors, and the cut-off value of extent of tumor resection, according to the 2016 WHO classification. Moreover, we found that the OS after surgery was 48.4 months for all anaplastic gliomas and 21.5 months in the AAw subgroup (Table 2).
Previously reported prognostic factors for anaplastic glioma include advanced patient age, preoperative neurological status, KPS, symptom duration, tumor location, EOR, adjuvant therapy (including radiation therapy and chemotherapy), preoperative MRI findings, as well as various molecular markers including IDH and PTEN mutations, 1p/19q codeletion, epidermal growth factor receptor (EGFR) amplification, and MGMT methylation [4,7-9,12-15]. The importance of these molecular markers for prognosis was reflected in the new WHO classification of 2016, which has had a great impact on the diagnostic criteria. Here, we have confirmed several prognostic factors including age, preoperative KPS, MGMT methylation status, postoperative tumor volume, and EOR.
Aggressive tumor resection can be dangerous for the patient’s neurologic function, especially when the tumor is located deep inside the brain. Thus, when evaluating the association between survival and the EOR, it is important to take the tumor’s location into account. In our series, tumor location was a statistically significant prognostic factor in univariate analysis, but its effect was lost in multivariate analysis. In addition, the association between preoperative tumor volume and survival rate was not statistically significant. These results suggest that the degree of surgical removal has a greater effect on the prognosis than the preoperative size and location.
In our univariate analysis, postoperative residual tumor volume and EOR were statistically significant prognostic factors for OS and PFS. This suggests that the extent of surgical resection and remaining tumor volume after surgery may have greater impacts on prognosis than preoperative volume (Table 3). However, in multivariate analysis, RTV-T1CE, RTV-T2, and EOR-T2 were statistically important prognostic factors (Table 4). The statistical insignificance of EOR-T1CE in multivariate analysis appears to be an effect of T2 lesions. Basically, T1 contrast-enhanced lesions are included in T2 lesions. Therefore, as shown in previous studies, we hypothesize that the EOR-T1CE still has significant prognostic value, and a study of the EOR cut-off value can be performed.
Malignant astrocytomas, including anaplastic glioma and glioblastoma multiforme, are difficult to resect curatively because of their invasive and infiltrative nature to the surrounding tissue [16]. This is especially difficult if the tumor is located in a functionally important region. However, microsurgical resection is a very important factor in the treatment of glioma, and maximal safe resection is known to be a good prognostic factor for all grades of gliomas [17-22].
In past, some studies had reported that there is no relationship between the EOR and survival in anaplastic gliomas [23,24]. However, recent studies have revealed that there is a relationship between the EOR and survival in anaplastic gliomas [3,25,26]. We performed volumetric analysis in the present study, confined to anaplastic gliomas, which have heterogenous features in MRI. A considerable proportion of anaplastic gliomas do not show contrast enhancement in T1-weighted MRI [15,17]. Therefore, to obtain a more accurate tumor volume, both abnormal T2/FLAIR hyperintense lesions as well as T1-weighted contrast-enhanced lesions should be considered. Previous studies analyzed EOR by combining tumor volume measured in T1-weighted contrast-enhanced images with that of T2/FLAIR image or T2 image alone [25,26]. To obtain more accurate information, we analyzed T2-weighted and T1 contrast-enhanced images separately and attempted to determine whether the EOR of each sequence affects survival rate.
Previous studies have found EOR thresholds of 76% in GIII glioma, 90% in GII glioma, 100% contrast enhancing resection with additional 53.21% of FLAIR hyperintense lesion in glioblastoma, and 53% in anaplastic astrocytoma and anaplastic oligoastrocytoma [18,22,25,26].
We investigated the cut-off value for the EOR on each MRI sequence (Table 5). The cut-off value of EOR affecting OS was 99.96% in contrast-enhanced T1-weighted MRI and 85.64% in T2-weighted MRI, so we propose that these EOR values are important for anaplastic gliomas. The use of multiple MRI sequences for suggesting the cut-off value of the volumetric EOR represents a strength of our study in the era of molecular glioma classification.
Age has already been identified as an important prognostic factor in several studies [3,7,24]. For example, a study has reported that an age of 65 years or older is a poor prognostic factor [27]. In the present study, we confirmed that age is an important factor affecting survival: 51 years old was the cut-off value that influenced the OS rate, while a cut-off of 55 years affected PFS.
Our study has some limitations. First, because of its retrospective nature from a single institution, there may be a selection bias of the patients. A few cases were excluded because of inadequate information of MRI available for review. However, we tried to analyze a uniform patient population by examining consecutive patients. Second, there may be measuring bias. Because we measured T2-weighted hyperintense lesions separately, cerebral edema, ischemic change, and contusions may have been included to tumor volume in some degree. Third, patients have received various chemotherapeutic agents although the regimens of chemotherapy did not have a statistical significance in univariate analysis. And the postoperative radiation therapy was not controlled. In the future, more controlled multicenter validation studies are required.
In conclusion, the median OS was 48.4 months in the whole anaplastic glioma group and 21.5 months in the AAw group. We have also revealed that complete resection (more than 99.96%) of tumor volume measured in contrast-enhanced T1-weighted MRI, and more than 85.64% of tumor resection measured in T2-weighted MRI, have prognostic impacts on the survival of patients with anaplastic gliomas. Therefore, gross-total resection of at least the contrast-enhanced part of a lesion should be performed to prolong survival in anaplastic glioma patients.