Introduction
Ovarian cancer, one of the deadliest female cancers, shows the lowest 5-year survival rate (46.5%) among gynecologic malignancies [1,2]. Globally, it accounts for 226,000 new cases and 158,000 cancer deaths each year [3], and its incidence has been gradually increasing in Korea [4]. The absence of cancer-specific symptoms and effective screening tools has led to high rates of ovarian cancer diagnosis in late stages, recurrence, and mortality [5].
The majority (90%) of ovarian cancers are epithelial ovarian cancers (EOCs) [6]. Ma ximal cytoreductive surgery followed by taxane- and platinum-based chemotherapy is conducted as the primary treatment in patients with advance-dstage EOC [7-9]. Nevertheless, 80% of patients who showed complete response after the primary treatment eventually experience the disease recurrence [10].
In keeping with the era of precision medicine, discovery of models predicting the exact prognosis of EOC is necessary as the first step of implementation of individualized treatment. To date, several prognostic indexes and predictive nomograms for the survival outcome of EOC have been developed based on pre-operative imaging such as computed tomography (CT) scans, differential blood cell counts such as platelet and neutrophil, tumor markers such as serum cancer antigen 125 (CA-125) levels, operative findings, or pathologic results [11-19]. However, these nomograms were developed in different disease settings (primary or recurrent EOCs), analyzed only fragments of clinico-pathologic factors, and had a low or limited prediction ability making it difficult for physicians to use them in clinical practice. Moreover, the prediction of primary treatment response to divide patients into possible platinum-sensitive recurrence (PSR) or platinum-resistant recurrence (PRR) groups would be useful in clinical trials on first and second-line treatments, reducing the relevant time and cost.
Thus, this study aimed to develop more precise web-based nomograms to predict treatment response and survival outcomes in EOC of patients from two high-volume tertiary institutional hospitals through comprehensive review of medical records and statistical analyses. All previously published and possible prognostic factors were included as far as possible and investigated in the current study.
Materials and Methods
1. Study population
From the Ovarian Cancer Cohort Databases of two tertiary institutional hospitals, we included patients who met the following inclusion criteria: (1) patients older than 18 years of age; and (2) those with EOC diagnosed and primarily treated at Seoul National University Hospital (SNUH) or Asan Medical Center (AMC) between January 2007 and August 2016. However, we excluded patients with the following conditions: (1) patients with any malignancy other than EOC; and (2) those with insufficient clinical data. As a result, we enrolled 866 patients who met these criteria; 570 from SNUH and 296 from AMC (S1 Fig.).
2. Data collection
We collected a vast amount of patients’ clinicopathologic data including 108 variables over 16 domains (S2 Fig.). Data acquisition included age, personal history, such as parity, familial history of breast cancer or gynecologic malignancies, and co-morbidities, such as hypertension or diabetes. Serum CA-125 levels and differential blood cell counts including neutrophil, lymphocyte, monocyte and platelet at initial diagnosis were obtained. International Federation of Gynecology and Obstetrics (FIGO) stage, histology and tumor differentiation, as well as details of primary treatment including the use of neoadjuvant chemotherapy (NAC), extent and individual procedures of debulking surgery, and administration and cycles of post-operative taxane- and platinum-based chemotherapy, were also obtained. Residual tumor size and sites after debulking surgery were investigated, and optimal debulking surgery was considered when the size of the residual tumor was less than 1 cm at the longest diameter. Pre-operative imaging studies and intra-operative surgical findings were also investigated.
All patients underwent CT scans and measurement of serum CA-125 levels every 3 cycles during post-operative adjuvant chemotherapy, and every 3 months for 1 year, then every 6 months for next 3 years during surveillance after primary treatment. Reponses to chemotherapy were evaluated by Response Evaluation Criteria in Solid Tumors (RECIST) ver. 1.1 [20].
For the survival analyses, progression-free survival (PFS) was defined as the time that elapsed from the start of the primary treatment (the date of primary debulking surgery [PDS] or the date of the first cycle of NAC) to the date of disease progression as evaluated by RECIST ver. 1.1 in patients with measurable disease [20]. In patients with unmeasurable disease, the Gynecologic Cancer InterGroup criteria using serum CA-125 levels were used to confirm disease progression [21]. Overall survival (OS) was defined as the time that elapsed from the date of initial diagnosis to the date of cancer-related death or end of the study. For all patients, the status of survival was investigated using both institutional medical records and the Social Security Death Index.
For the assessment of platinum sensitivity, only the patients who actually received taxane- and platinum-based chemotherapy as primary treatment were included. Among them, those who showed recurrence were classified into either PSR, defined as relapsing 6 months or more after completion of primary treatment, or PRR, defined as relapsing in less than 6 months. In addition to PSR, those who completed taxane- and platinum-based chemotherapy and did not experience disease recurrence for at least 6 months of the follow-up period were also considered platinum-sensitive.
3. Statistical analysis
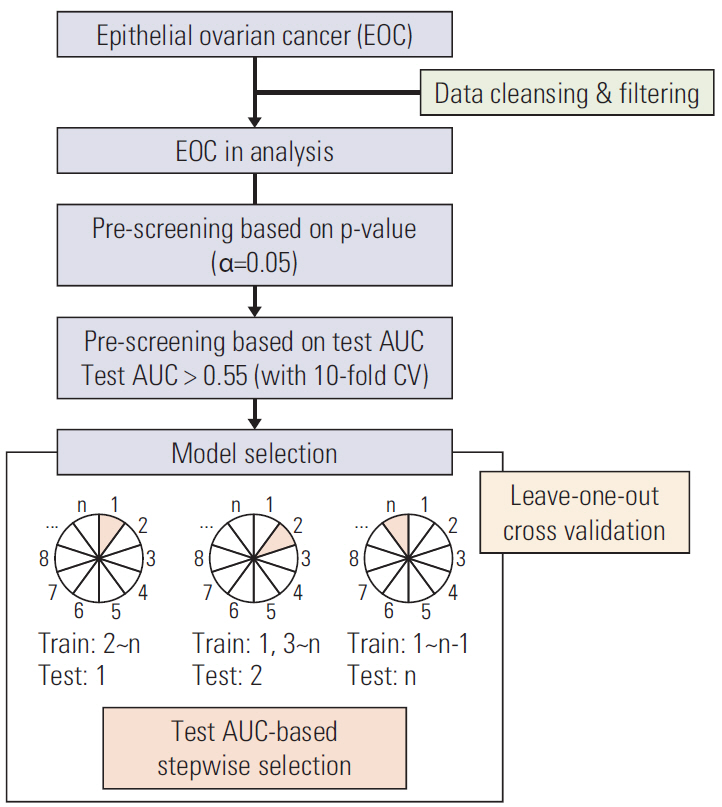
The overall work flow of statistical analysis is depicted in Fig. 1. In total, there were 86 clinical variables that could play a role as predictors of platinum sensitivity, 3-year PFS, and 5-year OS. After excluding 17 variables that had missing data in more than 10% of the patients or had sparse occurrence with observed counts of less than 10, we performed statistical analysis on the 69 remaining variables.
Some variables, such as serum CA-125 levels, were log-transformed to alleviate the skewness. For the eight variables that needed proper categorizations (age, histology, involvement of the spleen, omentum, small bowel and mesentery, colon except rectosigmoid, and liver surface, and residual tumor size after PDS or interval debulking surgery [IDS]), we selected the most suitable categorizations showing high statistical significances in univariate analyses. For platinum sensitivity, a logistic regression univariate model was used and for PFS and OS, Cox regression univariate models were used.
To exclude variables correlated with others, we selected a variable or a set of variables from the group as follows. Among weight, height, body mass index (BMI), and categorized BMI, BMI was used in the analyses. Similarly, among hemoglobin, differential blood cell counts, and their calculated secondary values, including neutrophil to lymphocyte ratio, monocyte to lymphocyte ratio, and platelet to lymphocyte ratio, the following variables were selected: hemoglobin, platelet count, neutrophil count, lymphocyte count, and monocyte count.
Before building the prediction models, univariate analysis was performed to screen for candidate clinical variables. First, p-value was applied with 0.05 as the cutoff since a variable with high area under the receiver operating characteristic curve (AUC) can be an important predictor only when it is statistically significant. Then, AUC was computed using the 10-fold cross-validation procedure and 0.55 was applied as the cutoff value. After screening, 26, 25, and 23 variables remained for the construction of models predicting platinum sensitivity, 3-year PFS, and 5-year OS, respectively.
To build the prediction models, a logistic regression model for platinum sensitivity and Cox regression models for PFS and OS were fitted in stepwise variable selection using the AUC. For Cox regression models, we constructed a time-dependent receiver operating characteristic curve and calculated time-dependent AUC [22]. AUC was computed by leave-one-out cross-validation as follows: we estimated the parameters of a model on n-1 samples and got a prediction on the remaining one with the estimated parameters from n-1 samples, where n is the sample size. This was repeated on all the samples so that we had n predicted values based on n estimated models. We computed AUC using the predicted values and the observed values of the response variable. The reason why we used AUC rather than the p-value, the Akaike's information criterion, or the Bayesian information criterion was that the aim of this study was to identify the model with the best prediction.
In order to select the first variable, we fitted as many univariate models as the number of predictors. For each variable, we computed AUC and selected the one with the highest AUC value. To search for the model with the highest AUC, we employed forward and backward stepwise selections Let x(m) be the variable to be selected at step m and Sm be the set which consists of x(1), ..., x(m). Suppose AUC(Sm-1, xi) represents AUC value using {Sm-1, xi}.
(1) Forward step: For each xi ∈ S m - 1 c
(2) Backward step: For each xi ∈Sm, AUC(Sm∖{xi}) was computed, where Sm∖{xi} represented the set Sm without xi. We deleted xi if AUC(Sm∖{xi}) was the highest and larger than AUC(Sm). If there was no further deletion, we proceeded to Step 3.
(3) Stop the stepwise method for variable selection.
The final models were used to construct nomograms for platinum sensitivity, 3-year PFS, and 5-year OS, respectively. To double-check the AUCs for the models, which were established from the stepwise selection by AUC using leave-one-out cross-validation, 10-fold cross-validation was applied.
All the statistical analyses were performed using the R statistical software ver. 3.4.3 (The R Foundation for Statistical Computing, Vienna, Austria; ISBN 3-900051-07-0; http://www.R-project.org). A p-value of < 0.05 was considered statistically significant.
Results
1. Patients’ clinicopathologic characteristics
The clinicopathologic characteristics of a total of 866 patients are presented in Table 1. The patients’ mean age was 53.5 years. Overall, 584 patients (67.4%) had FIGO stage III-IV disease, and the most common histologic type was serous type (61.1%). Details of primary treatment are also shown in Table 1. A total of 712 patients (82.2%) received PDS, whereas the other 154 (17.8%) received NAC followed by IDS. The rate of optimal debulking surgery was 90.3%. After surgery, 792 patients (91.5%) received post-operative taxane- and platinum-based chemotherapy. Among them, 616, 108 and 13 patients showed complete remission, partial remission and stable disease, respectively, whereas 55 patients showed progressive disease. Table 2 depicts pre-operative and intraoperative findings according to the anatomic sites. Analysis for ascites of peritoneal washing cytology was performed in 785 patients (90.6%), and malignant cells were detected in 482 patients (55.7%). Meanwhile, 76 patients (8.8%) presented pleural effusion at the time of diagnosis.
2. Patients’ survival outcomes and treatment response
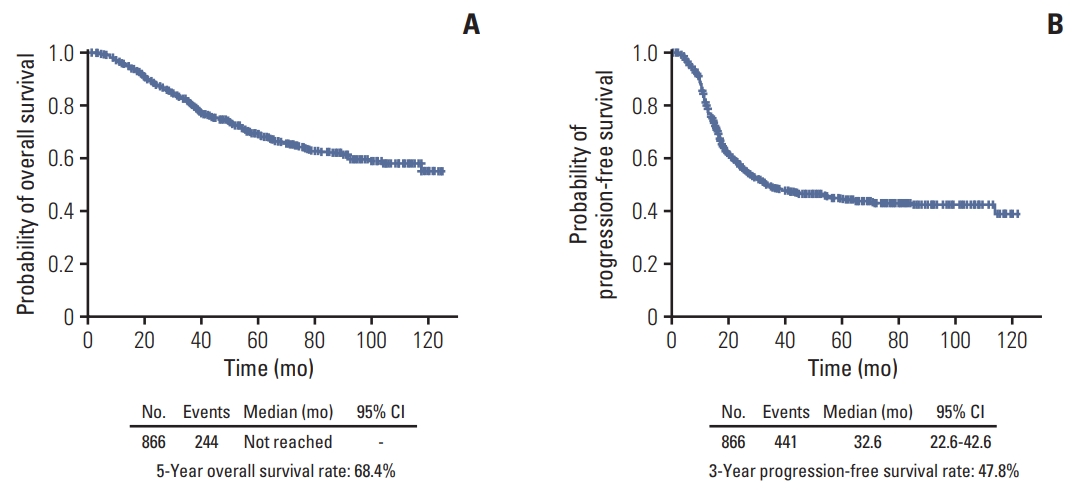
The median duration of follow-up for the 866 patients was 42.4 months (interquartile range, 25.7 to 69.9 months), during which 441 patients (50.9%) experienced disease recurrence. OS and PFS of the patients are displayed in Fig. 2. The median OS was not reached, while the median PFS was 32.6 months. The 5-year OS and 3-year PFS rates were 68.4% and 47.8%, respectively.
Survival outcomes according to the FIGO stage are presented in S3 Fig. Significant differences were observed in OS (p < 0.001), as well as in PFS (p < 0.001), according to the FIGO stage. The 5-year OS rates for FIGO stage I-II and stage III-IV were 91.9% and 55.8%, respectively, and the 3-year PFS rates were 84.9% and 30.6%, respectively. For stage III-IV, the median OS was 76.8 months and the median PFS was 17.9 months.
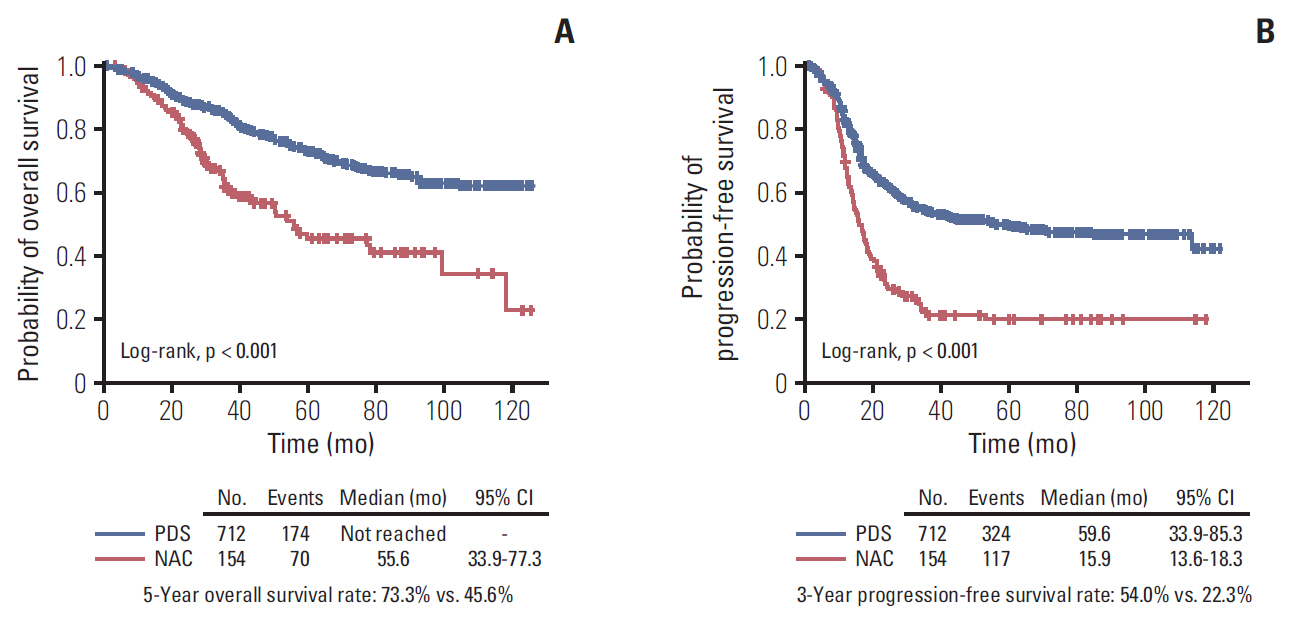
We also performed survival analyses according to the primary treatment strategies. Patients in the PDS group showed significantly better OS (5-year survival rates, 73.3% vs. 45.6%; p < 0.001) and PFS (median, 59.6 vs. 15.9 months; p < 0.001) compared to those in the NAC group (Fig. 3).
Among the recurred (n=441), 433 patients (98.2%) had received post-operative taxane- and platinum-based chemotherapy: in all, 285 patients and 148 patients were PSR and PRR, respectively. In the assessment of platinum sensitivity, 562 (64.9%) and 148 (17.1%) were classified as platinum-sensitive and -resistant patients, respectively (Table 1).
3. Development of predictive nomograms
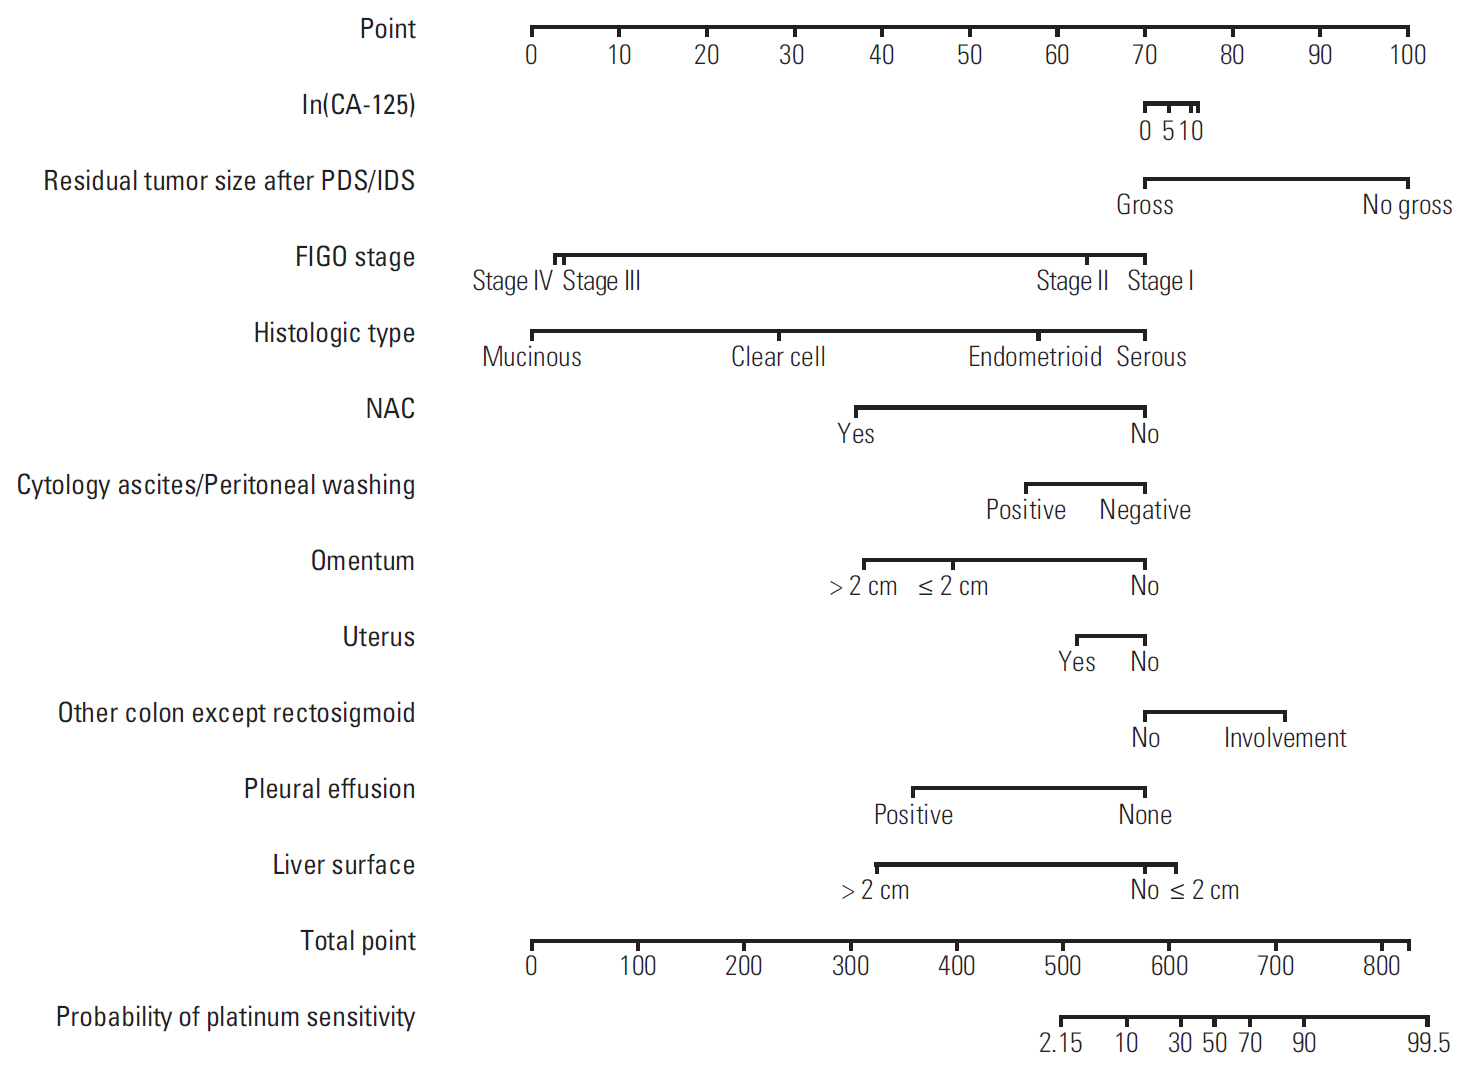
Using the statistical method described above, the nomograms were developed. Figs. 4, 5, and 6 depict the developed nomograms for platinum sensitivity, 3-year PFS, and 5-year OS, respectively.
The nomogram for predicting platinum sensitivity included the following variables: log serum CA-125 levels at diagnosis, FIGO stage, histologic type, NAC, pleural effusion, ascites or peritoneal washing cytology, involvement of the omentum, uterus, colon except rectosigmoid, and liver surface, and residual tumor size after debulking surgery. The AUC of this model was 0.758.
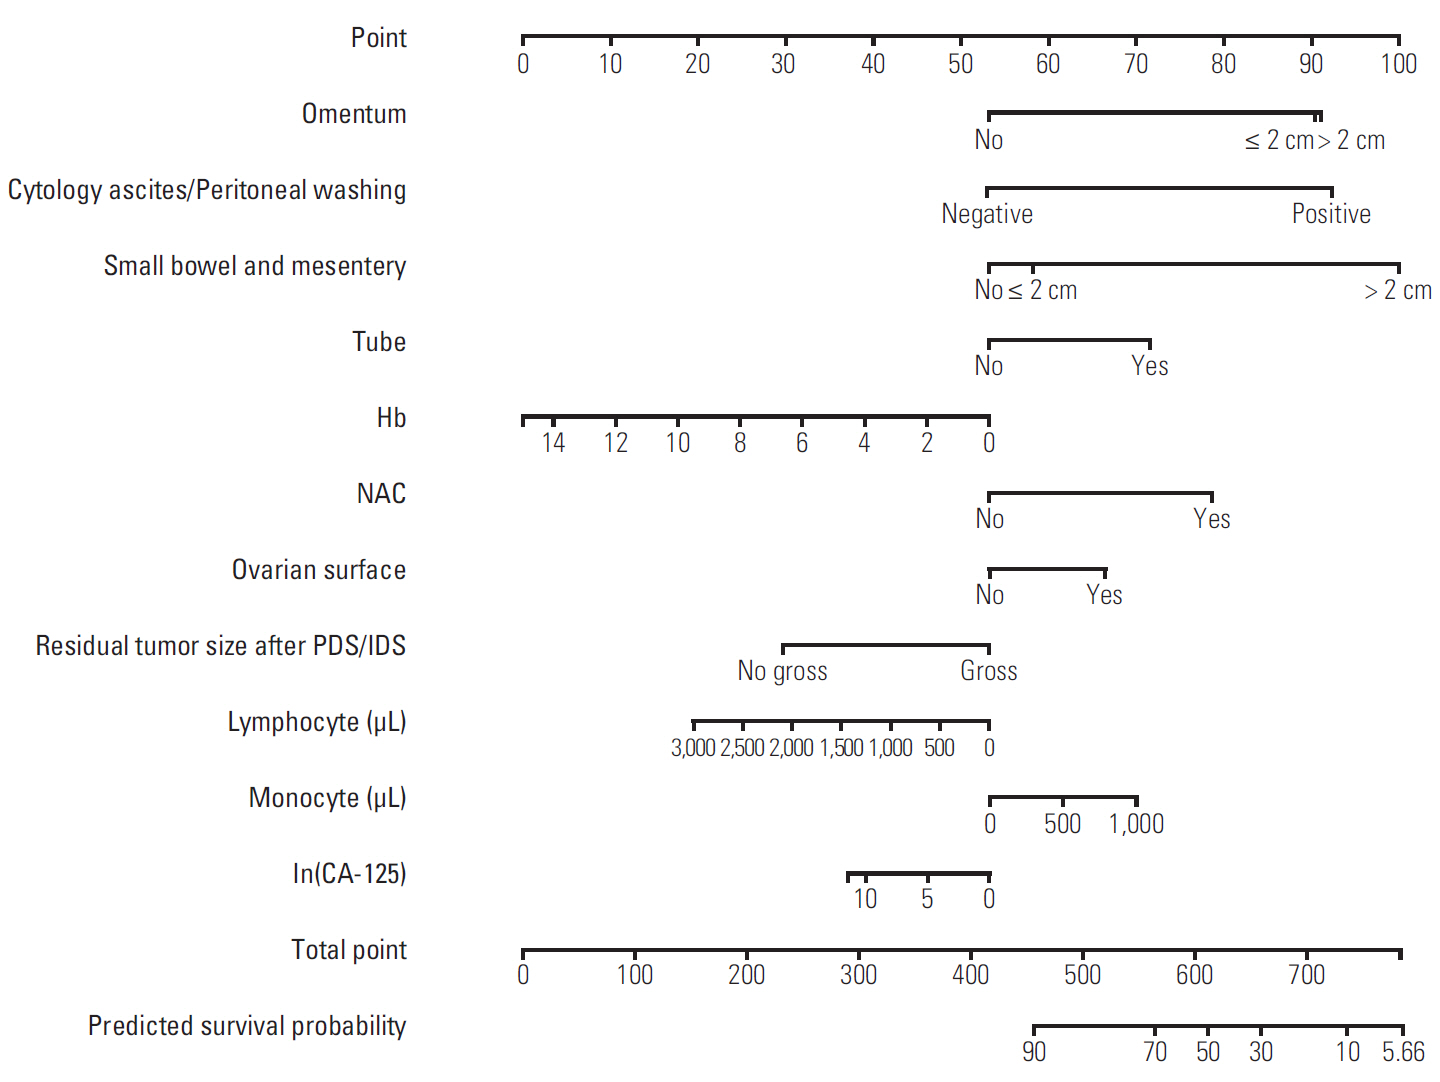
By the same algorithm, a nomogram for the prediction of 3-year PFS was developed. It was composed of hemoglobin, lymphocyte count, monocyte count, and log serum CA-125 levels at diagnosis, ascites or peritoneal washing cytology, NAC, involvement of the ovarian surface, tube, omentum, and small bowel and mesentery, and residual tumor size after PDS/IDS, with an AUC value of 0.841.
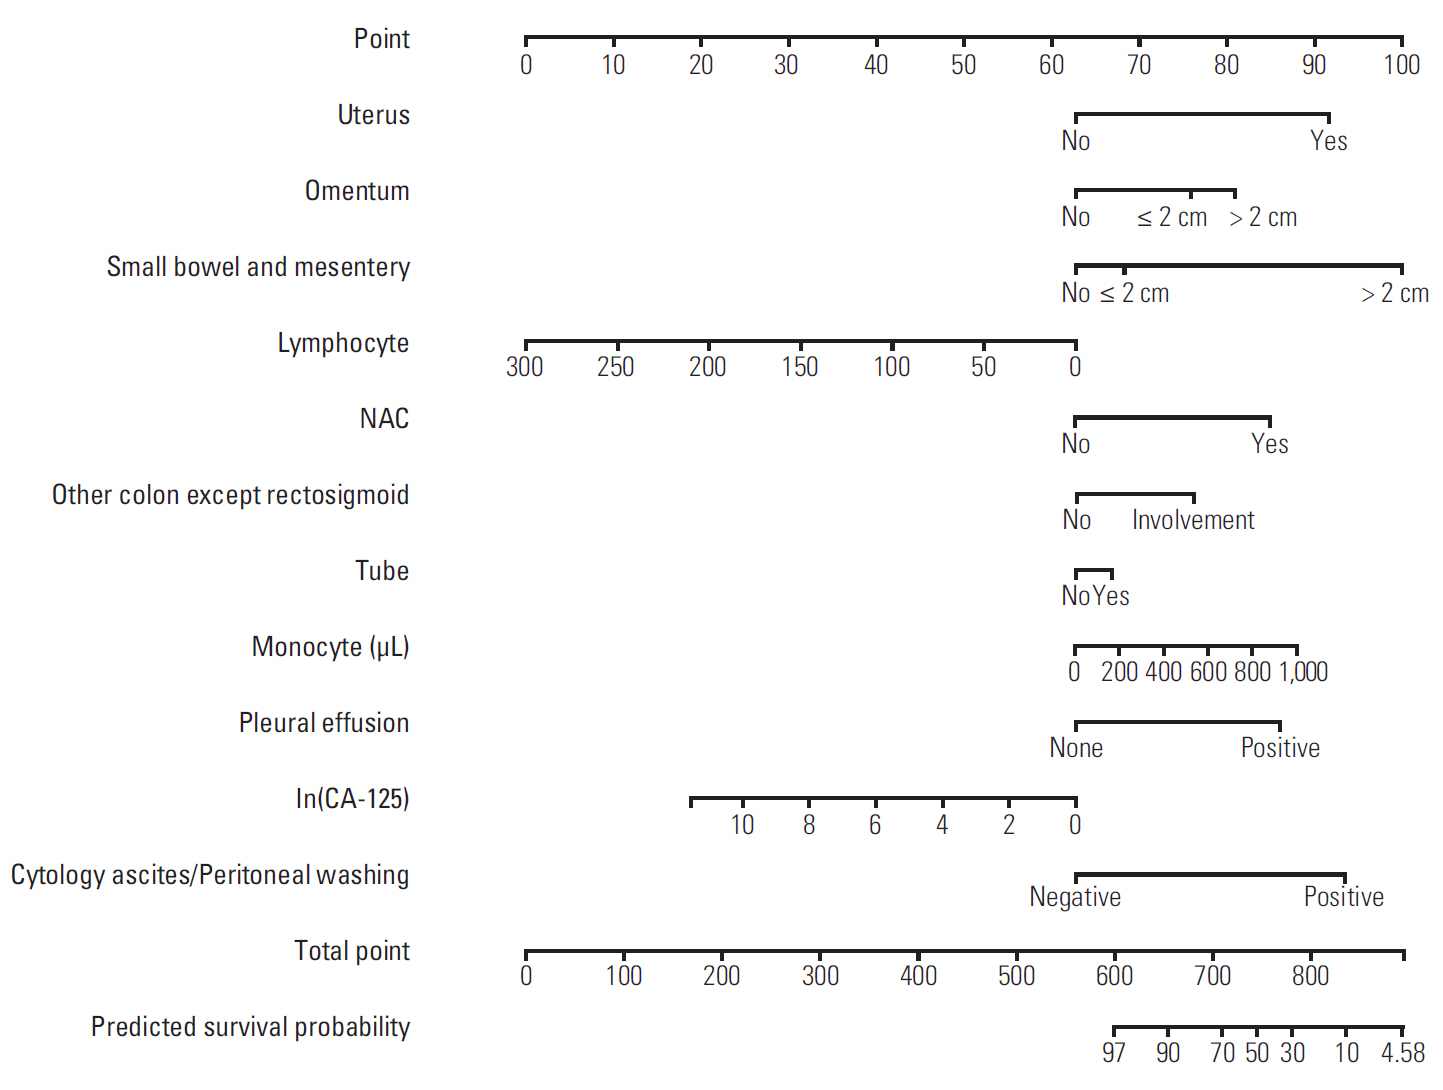
The newly developed nomogram for predicting 5-year OS consisted of lymphocyte count, monocyte count, log serum CA-125 levels, pleural effusion, ascites or peritoneal washing cytology, NAC, and involvement of the uterus, tube, omentum, colon except sigmoid, and small bowel and mesentery, with an AUC value of 0.805.
We performed 10-fold cross-validation to compute the AUCs of the nomograms for platinum sensitivity, 3-year PFS, and 5-year OS from stepwise selection by AUC using leave-one-out cross-validation. The values of AUC of the proposed nomograms were 0.743, 0.841, and 0.810 for platinum sensitivity, 3-year PFS, and 5-year OS, respectively. These values were similar to those we estimated by leave-one-out cross-validation.
Finally, we fitted a user-friendly interface on the developed nomograms and posted them onto a website (http://statgen.snu.ac.kr/software/nomogramOvarian) to facilitate clinical use. These web-based nomograms consisted of an HTML file for the input of the risk factors and a CGI file for the output of the calculated results.
4. Development of nomograms excluding patients who underwent NAC
We also developed predictive nomograms using the same procedure confined to the patients who underwent PDS. For platinum sensitivity, the nomogram consisted of hemoglobin, monocyte count, log serum CA-125 levels, pleural effusion, involvement of the uterus, omentum, and colon except rectosigmoid, and residual tumor size after PDS, with an AUC value of 0.713.
For 3-year PFS, the nomogram consisted of hemoglobin, lymphocyte count, monocyte count, segmented neutrophil count, FIGO stage, ascites or peritoneal washing cytology, and involvement of the tube, omentum, small bowel and mesentery, and large bowel resection with an AUC value of 0.839.
For 5-year OS, the nomogram included lymphocyte count, monocyte count at diagnosis, ascites or peritoneal washing cytology, and involvement of the tube, uterus, colon except sigmoid, and small bowel and mesentery with an AUC value of 0.803.
Discussion
In the present study, we successfully developed nomograms predicting platinum sensitivity, 3-year PFS, and 5-year OS of patients with EOC. The AUCs were calculated as 0.758, 0.841, and 0.805, respectively. To our knowledge, this is the first study developing predictive nomograms from two tertiary institutional hospitals in Korean patients with EOC.
In accordance with the era of precision medicine, demands on such predictive nomograms are increasing, and utilization of them will facilitate individualized treatment. As a nomogram visualizes the risks or benefits intuitively, a clinically relevant nomogram will be a useful tool during consultation between physicians and patients in clinical practice. For example, if an EOC patient was identified at high risk for recurrence or platinum resistance by our newly developed nomograms, she might undergo more aggressive treatments in addition to the standard treatment: intraperitoneal chemotherapy or bevacizumab maintenance treatment might be considered. Physicians might recommend her to receive germline BRCA1/2 testing as early as possible, so as to prescribe poly(ADP-ribose) polymerase (PARP) inhibitors based on the test results. Beside these aggressive treatments, more frequent surveillance schedule might be provided to the patients for earlier detection of recurrence than by usual methods.
To date, several nomograms predicting survival prognosis of EOC have been developed in various disease settings. In 2007, a Japanese multicenter study proposed a prognostic index to predict OS in FIGO stage III-IV disease [11], while a Memorial Sloan-Kettering Cancer Center group published a nomogram predicting 5-year OS after PDS confined to bulky stage IIIC disease in 2008 [12]. The same group further developed the nomogram, expanding it to the entire stage [14]. A two-center study in the Netherlands proposed nomograms for PFS and OS in patients with advanced-stage EOC [13]. An Australia research group used data from the CALYPSO trial and developed prognostic nomograms to predict platinum-sensitive recurrent EOC patients’ PFS and OS in 2011 and 2013, respectively [15,16]. Previs et al. [17] performed a multicenter retrospective study and reported a nomogram predicting 5-year OS probability in recurrent EOC patients who received bevacizumab and chemotherapy. In their multivariate model, prior number of chemotherapy regimens, treatment free interval, platinum sensitivity, and the presence of ascites were identified as prognostic variables [17]. Recently, a nomogram for survival in PRR was also developed by reviewing medical records of 164 patients retrospectively [19]. As described in the studies above, nomograms for EOC have been developed in different disease settings or study populations.
Compared to the previous studies, the current study had a different and more specific design. We confined the study population to those with EOC who received primary treatment in two tertiary institutional hospitals. We also collected a vast amount of patients’ clinic-pathologic data, trying to include all the previously published and possible prognostic factors as possible. Keeping in mind that the newly developed nomograms should be utilized in clinical practice or designing clinical trials, pre-operative and intra-operative findings were systematically organized. At the time of statistical analyses, we tried to avoid analyzing only fragments of clinic-pathologic factors. Rather, we performed stepwise selection method to select variables.
During stepwise variable selection, we also computed AUCs by 10-fold cross-validation, which were utilized for selecting variables, and obtained prediction models. When we repeated these processes, we observed a big variation in the selected models. This might originate from the existence of variables with similar prediction abilities. To solve such big variations among the selected models, we applied leave-one-out cross-validation when we computed AUCs in variable selection. As a result, we were able to provide prediction models which do not depend on random partitioning. Such a clear statistical method has contributed to increase the robustness and prediction accuracy of the developed model.
Interestingly, components of differential blood cell counts, as well as hemoglobin, were included in the nomograms as prognostic factors. In the nomogram for predicting 3-year PFS, hemoglobin, lymphocyte count, and monocyte count were included and in the nomogram for predicting 5-year OS, lymphocyte count and monocyte count were included. Among the previous studies on development of nomograms predicting prognosis of EOC, Gerestein et al. [13] reported that pre-operative platelet count was one of the prognostic factors for PFS, while pre-operative platelet count and serum hemoglobin concentration were prognostic factors for OS. In the retrospective study by Paik et al. [18], lymphocyte count and monocyte count were included in their nomogram for platinum sensitivity, while platelet count and neutrophil count were included in the nomograms for 3-year PFS and 5-year OS, respectively. It is well known that neutrophilic differentiation is induced by tumors through various chemokines, and is associated with angiogenesis and cell proliferation [23]. However, the scientific evidence underlying differential blood cell counts and its impact on the prognosis of EOC still remains unclear.
The current study had several limitations. Firstly, owing to the retrospective study design, inevitable issues, such as selection bias, may exist. Secondly, the developed nomograms were only validated internally using cross-validation methods. Although the cross-validation is well-known and reasonable, external validation processes in large-sized cohorts are still warranted. Lastly, use of targeted agents, such as bevacizumab, a monoclonal antibody targeting vascular endothelial growth factor A, and PARP inhibitors was not considered in this study because of very low proportions among the study population. In Korea, the National Health Insurance System (NHIS) started to cover bevacizumab in platinum-resistant relapsed EOC in August 2015 based on the results of the AURELIA trial [24], and in May 2018, started to cover bevacizumab in patients with PSR based on the OCEANS and GOG-0213 trials [25,26]. Meanwhile, although three recent randomized trials on maintenance therapy with three types of PARP inhibitors reported significantly improved PFS in platinum-sensitive relapsed EOC with BRCA mutation, only olaparib has been covered by NHIS since October 2017 [27]. If clinical data on these drugs accumulate, it would be worth developing a predictive nomogram for prognosis in EOC considering use of such drugs as variables.
Despite the study’s limitations, strengths of this study are as follows: (1) the specific study design and statistical methodology allowed us to integrate and analyze EOC patients’ clinicopathologic characteristics comprehensively, yielding valuable findings. (2) Compared to previously published studies, the sample size and the number of collected variables were larger in the current study. Especially, patients from two highest volume tertiary hospitals in Korea were included. Each hospital operates its own comprehensive cancer center. (3) Because we determined each patient’s survival status by querying the Korean government’s Social Security Death Index, survival data are very accurate. (4) Professional statisticians of the research team analyzed vast amount of patients’ data. Although policy for treatment of EOC is same, patients’ data might be somehow heterogeneous. However, the statisticians combined them well and successfully performed statistical analyses. (5) Predictive nomograms for the patients who will undergo PDS were also developed.
In conclusion, we have successfully developed nomograms for predicting platinum sensitivity, 3-year PFS, and 5-year OS of patients with EOC. By providing the exact prognosis of EOC to the individual patients, the nomograms are expected to be useful in clinical practice and in conducting prospective cohort studies or designing clinical trials. Furthermore, if the multi-omics data of EOC patients are added onto the predictive models, we expect that the predictive ability of the model will increase.