Introduction
Recently, considerable progress has been made in molecular studies of carcinogenesis and cancer progression. This deeper understanding has led to advances in new treatment strategies, including the use of molecularly targeted agents. One of the therapeutic targets in clinical use is the epidermal growth factor receptor (EGFR) [1-3]. EGFR, a member of the EGFR family, is known to be overexpressed in various cancers including colorectal cancer (CRC) [1,2]. Several EGFR signaling inhibitors, such as cetuximab and panitumumab, against the EGFR’s extracellular domain have an important clinical role in treatment and provide significant survival benefits in advanced CRC patients [4]. Unfortunately, a significant number of CRC patients with activated EGFR signaling suffered resistance to these treatments [4]. Several studies suggested that other genetic alterations influenced the therapeutic resistance in these cases, and more studies focused on the underlying mechanisms of resistance to EGFR inhibitors and predictive biomarkers to discriminate the patients who may receive greater benefits from treatment with EGFR inhibitors [4].
Various ligands are known to activate EGFR signaling, including heparin-binding epidermal growth factor–like growth factor (HBEGF), transforming growth factor (TGF), betacellulin, and epidermal growth factor (EGF) [5]. These ligands bind to the extracellular domain of EGFR and activate downstream signaling pathways [5]. Several studies have investigated the protein and mRNA expressions of some EGFR ligands, such as amphiregulin and epiregulin [6-8]. These ligands are commonly detected in CRC, suggesting their potential prognostic and predictive impact for anti-EGFR inhibition therapy in CRC [6,7,9-11]. Khelwatty et al. [8] also demonstrated that the evaluation of not only EGFR expression, but also the expression of its ligands may be used to predict the effect of anti-EGFR treatments. Furthermore, some EGFR ligands including HBEGF and betacellulin interact with human epidermal growth factor receptor 4 (HER4)— another member of the EGFR family—that may have close associations with favorable features and prognosis in cancer [12-14]. However, the clinicopathologic impact of various EGFR ligands and underlying mechanisms in ligand-dependent EGFR signaling remains unclear.
Therefore, wqe evaluated the mRNA expression of EGFR ligands including HBEGF, TGF, betacellulin, and EGF in a consecutive CRC cohort, and explored the clinicopathologic implications of EGFR ligands in relation to EGFR families.
Materials and Methods
1. Patients characteristics and tissue microarray construction
A total of 331 CRC samples were collected from 2005 to 2006 at Seoul National University Bundang Hospital. All patents had undergone curative surgical resection without preoperative chemoradiation therapy. Patients’ characteristics and clinicopathologic details including age, sex, tumor location, tumor differentiation, pathologic stage (American Joint Committee on Cancer TNM stage, seventh edition), time of death, tumor recurrence, and adjuvant chemoradiation treatment status were obtained from medical and pathologic records. Disease-free survival (DFS) was defined as the time from the date of curative resection to tumor recurrence and overall survival (OS) was calculated to the date of death. Of these 331 CRC cases, patients were treated with chemotherapy alone in 234 cases and both chemotherapy and radiotherapy in 15 cases. Among 188 patients with stage III/IV CRC, 155 and nine patients received treatments with additional chemotherapy alone and chemotherapy plus radiotherapy, respectively. After a microscopic review of each case, 2-mm-sized tissue cores from the most representative tumor areas were extracted to construct tissue microarray (TMA) blocks, as previously described [15].
2. mRNA in situ hybridization
Next, the expression levels of EGFR ligands were measured by mRNA in situ hybridization (ISH) using the RNA scope 2.0 HD Reagent kit (Advanced Cell Diagnostics Inc., Hayward, CA) on TMA blocks, according to the manufacturer’s instructions. After pretreatment with heat and protease, 4-μm tissue sections were incubated and hybridized with the target probes for EGFR ligands. Each hybridized slide was then hybridized with preamplifier, amplifier, and horseradish peroxidase‒labeled probes in order. The colorimetric reaction with 3,3′-diaminobenzidine followed. As a positive control, ubiquitin C staining was applied under otherwise identical conditions, and cases with negative or weak ubiquitin C signals were excluded from further analysis. The slides were scored according to the manufacturer’s scoring guideline: 0, no staining or less than 1 dot/cell; 1, 1-3 dots/cell; 2, 4-10 dots/cell; 3, > 10 dots/cell and dot clusters visible in less than 10% positive cells under ×20 objective; and 4, > 10 dots/cell and dot clusters visible in more than 10% positive cells under ×20 objective.
3. Immunohistochemistry and interpretation
Immunohistochemical staining was performed on the 4-μm-thick sections of TMA blocks with EGFR (pharmDX kit, prediluted, DAKO, Glostrup, Denmark), HER3 (1:20, DAKO), and HER4 (1:8,000, Thermo Scientific, Fremont, CA) antibodies. Staining was carried out according to the manufacturer’s protocols. In brief, the slides from the TMA blocks with 4-μm thickness were deparaffinized and rehydrated. Then, these slides were placed for antigen retrieval and incubated with antibodies [13,16,17]. EGFR-positive expression was defined as membranous staining in > 0% of the tumor cells, according to the DAKO EGFR pharmDX assay interpretation guideline. For evaluation of HER3 and HER4 expression, a previously described 4-tiered scoring system based on the staining intensity was applied [16]. The cytoplasmic and/or membranous expression of HER3 was categorized into four grades, as follows: 0, negative; 1, weak staining; 2, moderate staining; and 3, strong staining. In addition, cytoplasmic and nuclear expression of HER4 was evaluated separately. Positivity for HER3 and HER4 expression was considered as ≥ 10% of tumor cells with moderate to strong immunostaining.
4. Assessment of HER2 status
The evaluation of HER2 status was performed by immunohistochemistry and silver in situ hybridization (SISH), according to the DAKO HercepTest interpretation manual for gastric cancer [16]. The slides were stained with an antibody to HER2/neu (predilution, Ventana Medical Systems, Tucson, AZ) using an automated BenchMark XT stainer. HER2 SISH was also performed with INFORM HER2 DNA and INFORM chromosome 17 (CEP17) probes (Ventana Medical Systems). The entire core was scanned and the signals for 20 non-overlapping tumor cell nuclei were calculated in the hot spot area. HER2 status was considered positive if ≥ 10% of tumor cells revealed 2+ and 3+ immunostaining and a ratio between HER2 and CEP17 of ≥ 2.0 upon SISH.
5. Microsatellite instability determination
The microsatellite instability (MSI) status was determined using five markers of NCI recommended microsatellite loci (BAT-25, BAT-26, D5S346, D17S250, and D2S123) [13]. Briefly, tissue sections obtained from the tumor area and matching normal colonic mucosa were analyzed for MSI status using an automated DNA sequencer (ABI3731 Genetic Analyzer, Applied Biosystems, Foster City, CA). The MSI status was divided into three groups as followed: microsatellite stable (MSS; no unstable markers), microsatellite instabilitylow (MSI-L; one unstable marker), and microsatellite instability-high (MSI-H; two or more unstable markers).
6. Statistical analysis
We implemented the chi-square test and Fisher exact test to compare the differences between the expression of EGFR ligands and EGFR families, and various clinicopathologic characteristics. The Kaplan-Meier method with the log-rank test was applied for survival analysis. To analyze the prognostic significance of the expression of EGFR ligands and EGFR families, we performed univariate and multivariate Cox regression analyses. The SPSS ver. 21 (IBM Corp., Armonk, NY) was used for all statistical analyses, and we considered p < 0.05 as statistically significant.
Results
1. Patient characteristics
A total of 331 CRC cases consisting of 184 men and 147 women were included in this study. The median age of these patients was 66 years (range, 20 to 95 years). Regarding tumor histology, well to moderate differentiation was observed in 300 cases (90.6%), and poorly differentiated and mucinous-type CRCs were observed in 31 cases (9.4%). Of the 320 cases with available results for MSI status, 27 cases (8.4%) were categorized to MSI-H and 293 cases (91.6%) were determined as MSS/MSI-L. S1 Table summarizes the patients’ characteristics.
2. Expression of EGFR ligands and EGFR families in CRC
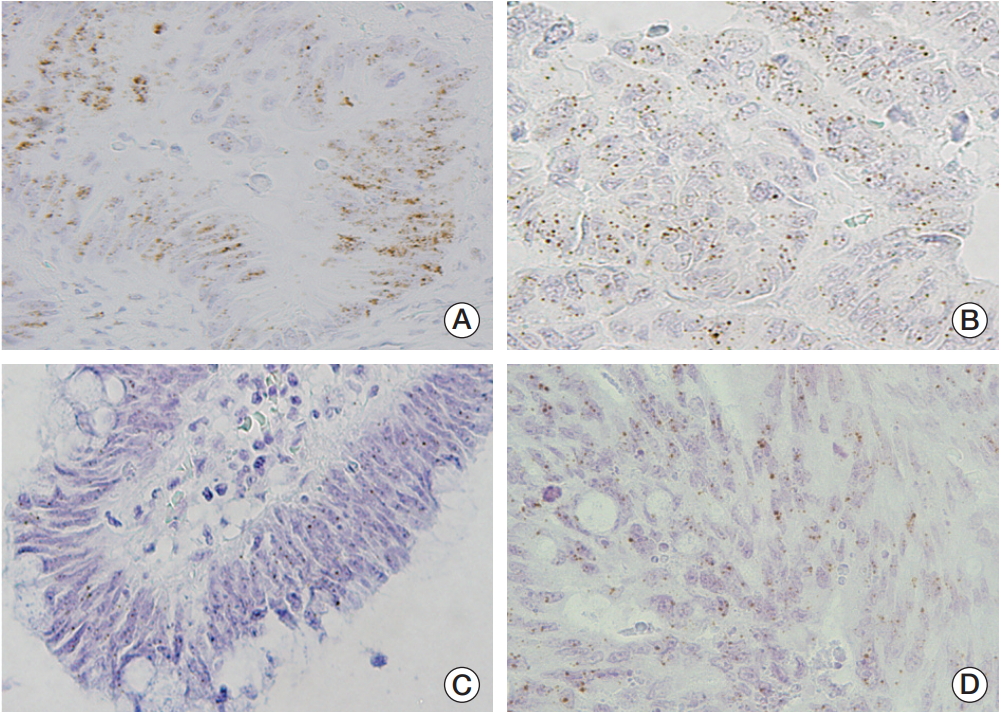
The expression of EGFR ligands was not detected in the non-neoplastic colorectal mucosa. In CRC, EGFR ligands were expressed in the cytoplasm of tumor cells. The CRC cases were divided into two groups according to the expression of EGFR ligands: positive (1-4) or negative (0). Although betacellulin (7.9%, 26/331) and EGF (2.1%, 7/331) were faintly expressed in a small number of CRC cases, expression of HBEGF and TGF were observed in 62.2% (206/331) and 38.1% (126/331) with various staining intensities, respectively (Table 1, Fig. 1).
Immunohistochemical expression for EGFR families were also performed in 331 CRC tissue samples, using TMA blocks. EGFR and HER3 were overexpressed in 129 (39.0%) and 228 (68.9%) out of 331 cases, respectively. Twelve cases (3.6%) showed HER2 positivity. Regarding to the sublocalization, HER4 cytoplasmic and nuclear expression were found in 207 (62.5%) and 36 (10.9%) cases, respectively.
3. Association between the expression of EGFR ligands and EGFR families
We explored the correlation between the expression of EGFR ligands and EGFR families. Our results revealed that HBEGF and TGF expressions were significantly associated with HER3 expression (p=0.003 and p=0.024, respectively). However, we did not observe other significant associations between the expression of EGFR ligands and EGFR families (Table 2).
4. Association between EGFR ligands and clinicopathologic variables
HBEGF expression revealed a positive correlation with low grade differentiation (p < 0.001), but not with other various clinicopathologic characteristics (all p > 0.05). TGF expression revealed a tendency to be detected in low-grade CRCs with borderline statistical significance (p=0.062). Although the frequencies were low, EGF positivity was associated with vascular invasion (p=0.025) and tended to be detected in CRC with expanding tumor borders (p=0.066). However, no significant difference between betacellulin expression and various clinicopathologic variables was noted. Regarding the association with MSI status, TGF expression was significantly associated with MSS/MSI-L status (p=0.009) (S1 Table). Upon Kaplan-Meier survival analysis with the log-rank test, no significant relationships with either DFS or OS were revealed according to the expression status of each EGFR ligand in CRC (S2 Fig.).
5. Combined analysis of EGFR ligands and EGFR in CRC
We assessed the correlation with clinicopathologic parameters depending on the combined status of EGFR ligands. A total of 241 cases (72.8%) revealed positivity for at least one EGFR ligand in CRC. EGFR ligand positivity was significantly correlated with low grade differentiation (p < 0.001) and the presence of lymphatic invasion (p=0.030), but not with other clinicopathologic factors. The expression of EGFR ligands was more frequently detected in MSS/MSI-L CRC (p=0.009) (Table 3).
Next, we analyzed the clinicopathologic significance depending on the combined status of EGFR ligands and EGFR expression. Interestingly, the EGFR-positive CRC group without ligand expression revealed a significant association with poorly differentiated histology (p=0.023) (Table 4). We explored survival differences using Kaplan-Meier analysis. Patients with ligand–/EGFR+ revealed the worst DFS compared to other groups, but these differences were not statistically significant (p=0.123). The ligand–/EGFR+ group also revealed the poorest OS (p=0.039). After dichotomization, we compared the prognostic significance in the CRC with ligand–/EGFR+ group compared to the CRC with any other expression group; patients with ligand–/EGFR+ revealed significantly shorter DFS and OS (p=0.018 and p=0.005, respectively) (Fig. 2). Moreover, we performed multivariate analysis to determine the prognostic impact. In the Cox model, dichotomization into EGFR ligands–/EGFR+ and others predicted unfavorable DFS and OS (p=0.026 and p=0.007, respectively). Tumor differentiation, invading borders, neural invasion, and pathologic stage also indicated their prognostic significance for patients’ survival (Table 5).
6. Association of combined status of HBEGF, betacellulin, and HER4 expression with clinicopathologic paracmeters
Since HBEGF and betacellulin have also been reported as ligands for HER4, we explored the clinicopathologic significance of HBEGF, betacellulin, and HER4 expression. HER4 cytoplasmic expression was found in 207 cases (62.5%), while its nuclear expression was observed in 36 cases (10.9%) (S3 Fig.). HER4 cytoplasmic expression was correlated with lower T category (p=0.004). HER4 nuclear immunoreactivity was significantly associated with lower T category (p=0.001) and the absence of lymphatic invasion (p=0.043). Other clinicopathologic parameters were not correlated with HER4 cytoplasmic or nuclear expression (Table 3). Patients with HER4 nuclear expression, regardless of its ligands, HBEGF and betacellulin expression status, revealed superior DFS (p=0.035) and OS (p=0.030), as determined in the survival analysis. However, we failed to determine a significant correlation between HER4 cytoplasmic expression or its co-expression with its ligands with regard to DFS and OS (S4 Fig.). HER4 nuclear expression predicted favorable DFS and OS upon multivariate analysis (p=0.034 and p=0.049, respectively) (Table 5).
Discussion
In this study, we found that EGFR ligands including HBEGF, TGF, betacellulin, and EGF were expressed with various intensities in CRC tissue. While we failed to determine the significant prognostic values of each EGFR ligand, CRC patients with EGFR overexpression and no other ligand expression presented with significantly unfavorable outcomes, compared to others. This result indicated its independent prognostic value for poor survival. Furthermore, HER4 nuclear expression, regardless of its ligands, HBEGF, and betacellulin expressions, is also a better prognostic indicator for CRC. Our results may provide the basis for understanding EGFR signaling pathways and the development of new treatments targeting EGFR signaling.
EGFR, a well-known transmembrane receptor kinase, is composed of three structural and functional domains: the extracellular ligand binding domain, transmembrane region, and cytoplasmic domain containing tyrosine kinase [18]. Previous studies identified two different EGFR downward signaling pathways. Various ligands activate EGFR signaling by binding to the extracellular domain, which results in conformational changes of EGFR and activation of several canonical signals, such as ERK and Akt [5]. Contrary to ligand-dependent signaling, ligand-independent constitutive activation of EGFR induces a distinct signaling pathway through the transcription factor interferon regulatory factor 3 [18,19]. Interestingly, these two signaling pathways are exclusively activated [18,19].
Previous studies have mainly focused on the prognostic and predictive impacts of amphiregulin and epiregulin, which are commonly expressed in CRC and might be associated with favorable prognostic effects in CRC [6,7,9-11]. However, the clinicopathologic implications of other ligands, including HBEGF, TGF, betacellulin, and EGF, are insufficiently investigated. For HBEGF, a pivotal role in cancer progression has been proposed in various cancers, including cervical, breast, and gastric cancers [20-23]. In CRC, Kawasaki et al. [24] suggested that HBEGF has roles in CRC progression through the recruitment of intestinal myofibroblasts. In our cohort, although HBEGF expression is commonly detected in CRC, we were unable to determine a significant correlation with various clinicopathologic factors except for tumor differentiation. Interestingly, stromal HBEGF expression was observed in 21.5% (71/331) of our cohort. Among these, 63 cases revealed HBEGF expression in both stromal and tumor cells (S5 Fig.). Recent studies by Schrevel et al. [20] and Murata et al. [25] described the possible role of HBEGF from fibroblasts and macrophages, which are associated with cancer cell proliferation in cervical cancer. Based on these results of HBEGF expression in the tumor microenvironment, we analyzed the association between stromal HBEGF expression and clinicopathologic parameters, but no significant differences including patients’ survival depending on stromal HBEGF expression was observed in CRC (data not shown).
A recent study by Khelwatty et al. [8] conducted in metastatic CRC using immunohistochemistry, demonstrated that betacellulin was the most commonly expressed ligand and was associated with unfavorable prognosis in metastatic CRC. However, HBEGF expression was not detected in that study. Inconsistent with their results, our study found different expression frequencies, wherein HBEGF and TGFwere relatively commonly expressed, while betacellulin expression presented in only a few subsets of the consecutive CRC cohort, using mRNA ISH. Immunohistochemistry is considered as a reproducible and efficient tool for the characterization of proteins of interest on formalin fixed paraffin embedded slides. However, there is a paucity of reliable commercially available immunohistochemical antibodies against various EGFR ligands. In addition, the cutoff value of immunohistochemical expression for EGFR ligands remains variable and controversial. Yoshida et al. [26] observed the predictive impact of ≥ 30% expression of four EGFR ligands including amphiregulin, HBEGF, TGF-α, and epiregulin. Khelwatty et al. [8] adopted various cutoff points (> 5-50% of tumor cells) for each EGFR ligand to avoid the effect of low specific staining. Considering the above matters, we evaluated the expression of four EGFR ligands, using mRNA ISH, but mRNA levels were not completely overlapping with the levels of their translated protein expression. It was expected that several factors including different cohorts and detection methods may contribute to explain these discordant results. In addition, previous studies have evaluated the mRNA expression of several EGFR ligands including EGF, TGF in colon cancer cell lines and human colon cancer tissue [27,28]. As these studies, EGFmRNA was significantly expressed in colon cancer cell lines and fresh-frozen human colon cancer specimen. Rajagopal et al. [28] also detected the EGFmRNA expression in non-neoplastic colon specimen, by reverse transcription–polymerase chain reaction analysis, in contrast with our results that no EGFmRNA expression was found in non-neoplastic colonic mucosa. In present study, we examined EGR ligand expression in formalin fixed paraffin embedded specimens by mRNA ISH. The difference of samples used for mRNA measurements and detection methods might explain these conflicting results. Further studies regarding the expression of EGFR ligands are warranted to validate these results.
Because the expression of each EGFR ligand was not a prognostic marker in CRC according to our results, we adopted the combined expression status of four ligands to evaluate the clinicopathologic significance of ligand associated EGFR overexpression in CRC. Our results revealed that ligand-independent EGFR overexpression was related to poor prognosis in CRC patients. In addition, different from low-affinity ligands such as amphiregulin and epiregulin, the ligands that we tested, including HBEGF, TGF, betacellulin, and EGF, are known as high-affinity ligands and these ligands have relatively high levels of signaling potential and activating effects for canonical pathways [6]. From these findings, we infer that ligand-dependent EGFR signaling is not a decisive factor for poor prognosis. Several recent studies have described that there were two distinct signaling pathway, ligand dependent and ligand independent constitutive pathway and these two signaling showed the mutually exclusive nature [18,19]. However, the downstream signaling of EGFR activation cooperatively or independently with EGFR ligands was not clear in CRC. In present study, we evaluated the expression status of EGFR and its ligands and showed the prognostic impact depending on their expression phenotypes in CRC, but we could not show the association with EGFR downstream signaling deeply. Furthermore, immunohistochemical staining using EGFR pharmDX antibodies, which were used to determine the expression status of EGFR in this study, have also been identified to be reactive in cases of EGFRvIII mutants, which trigger ligand-independent EGFR signaling [19]. Given these points, our study has certain limitations and further studies will be necessary to elucidate EGFR downstream signaling, considering the association of its ligands in CRC.
For HER4 expression, immunohistochemically, cytoplasmic localization was the predominant pattern and some cases revealed nuclear immunostaining in our study. HER4 activation generates two structurally and functionally different isoforms by alternative splicing: CYT1 and CYT2. While the CYT2 isoform can enter the nucleus easily and regulates transcription related to favorable features including cell differentiation, the CYT1 isoform is insufficient to translocate into the nucleus and contains a phosphatidylinositol-3 kinase binding motif to activate its signaling pathway to induce tumor cell proliferation [13,14]. These findings suggested that, as for staining patterns, nuclear accumulation of HER4 might indicate better prognosis, in contrast to cytoplasmic localization that is associated with tumor progression [12]. We previously reported that HER4 nuclear expression might be regarded as a favorable prognostic marker in gastric cancer [13]. However, clinicopathologic significance depending on the subcellular localization of the HER4 protein was not fully evaluated in CRC. Based on the results of previous studies, cytoplasmic HER4 indicated a positive association with poor survival in CRC [12,29]. In our study, the prognostic impact of HER4 cytoplasmic expression was not significant, which was inconsistent with previous results. Moreover, HER4 nuclear expression was significantly associated with the absence of lymphatic invasion and lower pathologic stage, and was determined to be an independent factor for improved prognosis in CRC. These findings are generally consistent with the results demonstrated in gastric cancer [13]. Interestingly, these prognostic impacts were not influenced by the status of its ligands, or HBEGF and betacellulin expressions. Therefore, our results suggest that HER4 nuclear expression, not cytoplasmic localization, and regardless of ligand expression, might be a biomarker for predicting better prognosis in CRC patients. Because there were more known ligands for HER4 that we did not test, larger and more comprehensive studies for the subcellular localization of HER4 expression are needed to explain the underlying mechanism and the different prognostic impacts in CRC.
In conclusion, we identified that EGFR overexpression without ligand expression could be a biomarker for unfavorable prognosis. Moreover, the evaluation of EGFR ligand expression, in addition to EGFR expression, could provide meaningful information for predicting patients’ survival in CRC. Together, HER4 nuclear expression, regardless of its ligands expression, is suggested as an independent favorable prognostic factor in CRC.