Introduction
Epithelial ovarian cancer (EOC) is one of the leading causes of death in patients with gynecologic malignancy and the incidence of EOC has been increasing gradually [1,2]. EOC presents at a late stage in most cases and is known to have high pathological and molecular heterogeneity [3,4]. Although 75% of EOC patients achieve complete response after primary debulking surgery and chemotherapy, 40%-60% of all patients will eventually experience recurrence [5-7]. Understanding the molecular biology and its pathogenesis is expected to present accurate prognosis predicting indicators and improved therapeutic methods for EOC.
Lymphatic invasion is known as a predictor of the aggressiveness and affects the survival of patients with EOC [8]. Regarding lymphatic invasion in EOC, lymphadenectomy is possibly associated with surgical morbidities [9,10] and unnecessary procedure should be avoided. Recently, a lot of effort was made to integrate molecular signatures for precise prognosis; this helps classify patients into disparate risk groups and may provide more personalized treatment [11]. However, information on predictors for lymphatic invasion status in EOC patients is still lacking, and few molecular prognostic classifiers are available.
The Cancer Genome Atlas (TCGA) offers considerable opportunities to increase our knowledge of the molecular foundation of cancer, and data at multiple molecular levels have recently became available [12]. Data from DNA methylation at the epigenetic level, which plays an important role in controlling gene activity, and from gene (mRNA) at the level of the transcriptome are the most representative datasets. As the cancer genome is rather complex and is associated with numerous molecular mechanisms [13,14], a single level of molecular data is insufficient to include all of the information associated with the process. By integrating multiple levels of molecular signatures for the layered processes of the biological system, a more acceptable prediction of the cancer phenotype can be provided.
In this study, we aimed to find predictors based on molecular signatures related to lymphatic invasion in EOC and to validate the prognostic significance of the signatures through analysis of mRNA, and methylated DNA expression profiles from the TCGA database.
Materials and Methods
1. Patients and data collection for the prediction model
Clinical information from TCGA Data Portal (https://tcga-data.nci.nih.gov/docs/publications/tcga/) and molecular data including DNA methylation, and mRNA were obtained before performing downstream analysis. Molecular data were used from the following platforms: for DNA methylation, the platform was Illumina Infinium Human DNA Methylation 27K (Illumina, San Diego, CA); for mRNA expression, the platform was Illumina HiSeq 2000 RNA Sequencing V2. This study meets the publication guidelines provided by TCGA (http://cancergenome.nih.gov/publications/publicationguidelines). Tables 1 and 2 show the data description of the multilevel genomic datasets for ovarian cancer, and patients’ characteristics.
2. Selection of differentially expressed genes according to lymphatic invasion
To identify differentially expressed genes (DEG) between lymphatic invasion (–) and lymphatic invasion (+) tumors, level 3 pancancer-normalized expression levels were used. Because many genes were not expressed in certain samples or showed few variations between the patients in the dataset, only genes expressed in at least two lymphatic invasions (–) or lymphatic invasion (+) samples were retained in the profile. The differences in expression were featured by logFC (log2 fold change) and associated p-values. LogFC designates the fold change in expression of each gene from lymphatic invasion (+) to lymphatic invasion (–). Downregulated and upregulated genes were distinguished as logFC < –1 and logFC > 1, respectively, with false discovery rate (FDR)-adjusted p < 0.05. To identify a molecular signature that is robustly associated with lymphatic invasion, we calculated the median FDR, which is the percentage of falsely detected genes as showing statistically significant DEG.
3. Molecular signature for lymphatic invasion
Logistic regression with backward elimination was applied to develop a prognostic model for lymphatic invasion using the selected genes. We used selected features to acquire a regression coefficient for each feature and to create a model to assess the prognosis prediction score as follows: prognostic score for mRNA=(2.3108+0.2983×HTR3A–0.6302 ×PCP4–0.8574×CAPN9–0.7095×MASP1+1.3189×CYP8B1–0.4935×GDF5+1.7850×AOAH+1.7531×ADORA3–0.4757×CLCNKB+0.7888×EBI3+1.0577×LILRB3+1.9022×C16orf54+0.5381×PODNL1+2.7914×DCN+0.5553×USH2A+2.1488×FGD2–5.9784×TNFAIP8L2–1.0032×SP140–3.1931×WISP1–0.7937×SH2D4B–1.9687×RUNX1); and prognostic score for methylation=(–0.8776+1.9637×ITGBL1+2.7273×CAPN9+2.6450×LOC84391–4.3617×ACAP1–1.1581×ADORA3–4.4722×FBN3+2.4902×CD37). The performance of the model was measured using receiver operating characteristics (ROC) curves by comparing the area under the curve (AUC) of the respective ROC.
4. Validation of prediction accuracy
Next, we compared the prediction efficiency of the logistic regression model with that obtained using the Logitboost model based on the same set of selected genes [15]. Internal validation was done by a 200-fold cross-validation method to distinguish the samples as lymphatic invasion (–) or lymphatic invasion (+). This method to risk classification used the median index values acquired from 90% of the cases (training set) to divide the residual 10% of the missed cases (test set) according to this median estimate. All cases were stratified after the entire process had been repeated 200 times, with a different 10% of cases omitted until each case had been excluded.
We further validated the classifier using two classification algorithms: linear discriminant analysis (LDA) and support vector machine (SVM). Both algorithms were repeated 100 times, and the accuracy was compared using the concordance index. Linear SVM classifier aims to find an optimal hyperplane to separate the classes in the high-dimensional gene space with the generalization ability maximized and over-fitting avoided [16]. We used the weighted difference of means of genes in the SVM decision function to evaluate the relative importance of genes and eliminated unimportant genes iteratively by a backward feature elimination process. SVM-based predictions function well on small sample sets in high-dimensional spaces [17].
5. Molecular signature of lymphatic invasion predicted survival of EOC patients
We gathered candidate features of molecular data and randomized the data set into training (80%) and test (20%) sets. We then made the survival predictive models from the training set using random survival forest (RSF) [18]. The RSF models were created by the R package “RandomSurvival-Forest” with the recommended default reference values. We then applied the models to the test set for prediction and assess the C-index. For each core set, the process mentioned above was reiterated 100 times to extract 100 C-index values. In comparing the performance between different data types, the results based on the Wilcoxon signed rank test to assess the p-value using 0.05 as the significance cutoff were used. To calculate the predictive power of incorporating molecular signatures with clinical factors, we adjusted the RSF method to contain both clinical variables (International Federation of Gynecology and Obstetrics [FIGO] stage, grade, lymphatic invasion, and residual disease status after primary treatment) and molecular features. We used the lymphatic invasion as the reference for creating the clinical RSF model. We then combined the molecular-level signatures more appropriate for the existing model by processing a feature-selection step against the remainders.
In addition, we used Pathifier (http://www.weizmann.ac.il/pathifier), an algorithm that calculates pathway deregulation scores (PDS) for each sample based on expression data [19]. In brief, Hastie and Stuetzle’s algorithm [20] was used to find a principle curve. Then, we project to the closest point from each sample, and the deregulation score of sample is defined as the distance along the curve. In this study, the reference set is composed of the sample without lymphatic invasion. The distance provides a measure of the extent to which the expression levels of the genes associated with lymphatic invasion were perturbed in each sample with lymphatic invasion. The algorithm transforms gene-level information into pathway-level information. Kaplan-Meier survival curves were drawn according to the PDS, and the log-rank test p-values were calculated using the R package “survival.”
For external validation of the result, we used additional analysis of gene expression dataset from the study which we previously published [21]. Twenty-six serous adenocarcinomas with stage IIIC/IV were used, and 14 patients had recurrence within 6 months and the remaining 12 patients had no recurrences. Patients’ characteristics are shown in Table 3. For further validation of the selected genes, we used a meta-analysis using gene expression data on tumors, with carefully curated clinical annotations, which is available in the curatedOvarianData database [22].
6. Statistical analysis
In each data set, we used Monte Carlo cross-validation and calculated the predictive power of individual molecular data types using the C-index [23]. The C-index is a nonparametric indicator to quantify the differential power of a prediction model: a C-index of 0.5 is considered as good as a random guess. Progression-free survival (PFS) and overall survival (OS) curves were created with the Kaplan-Meier method and the log-rank test. We conducted all statistical analyses with the R statistical language ver. 3.1.0.
Results
1. Identification of molecular signatures associated with lymphatic invasion
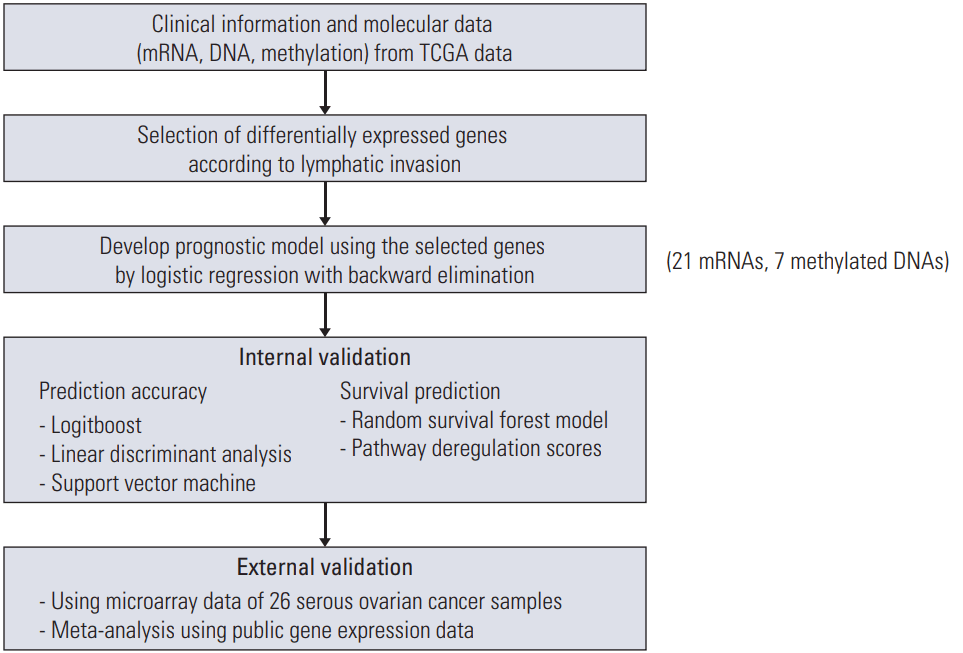
Flowchart illustrating analysis is shown in Fig. 1. Analysis of gene expression profiles with or without lymphatic invasion identified several differentially expressed mRNAs (n=21), and methylations (n=7), which were used for subsequent analysis (S1 and S2 Tables). Of these, six mRNAs were overexpressed, and 15 mRNAs were downregulated. For methylation, two genes were overexpressed, and five genes were downregulated.
2. Validation of lymphatic invasion prediction using molecular signatures
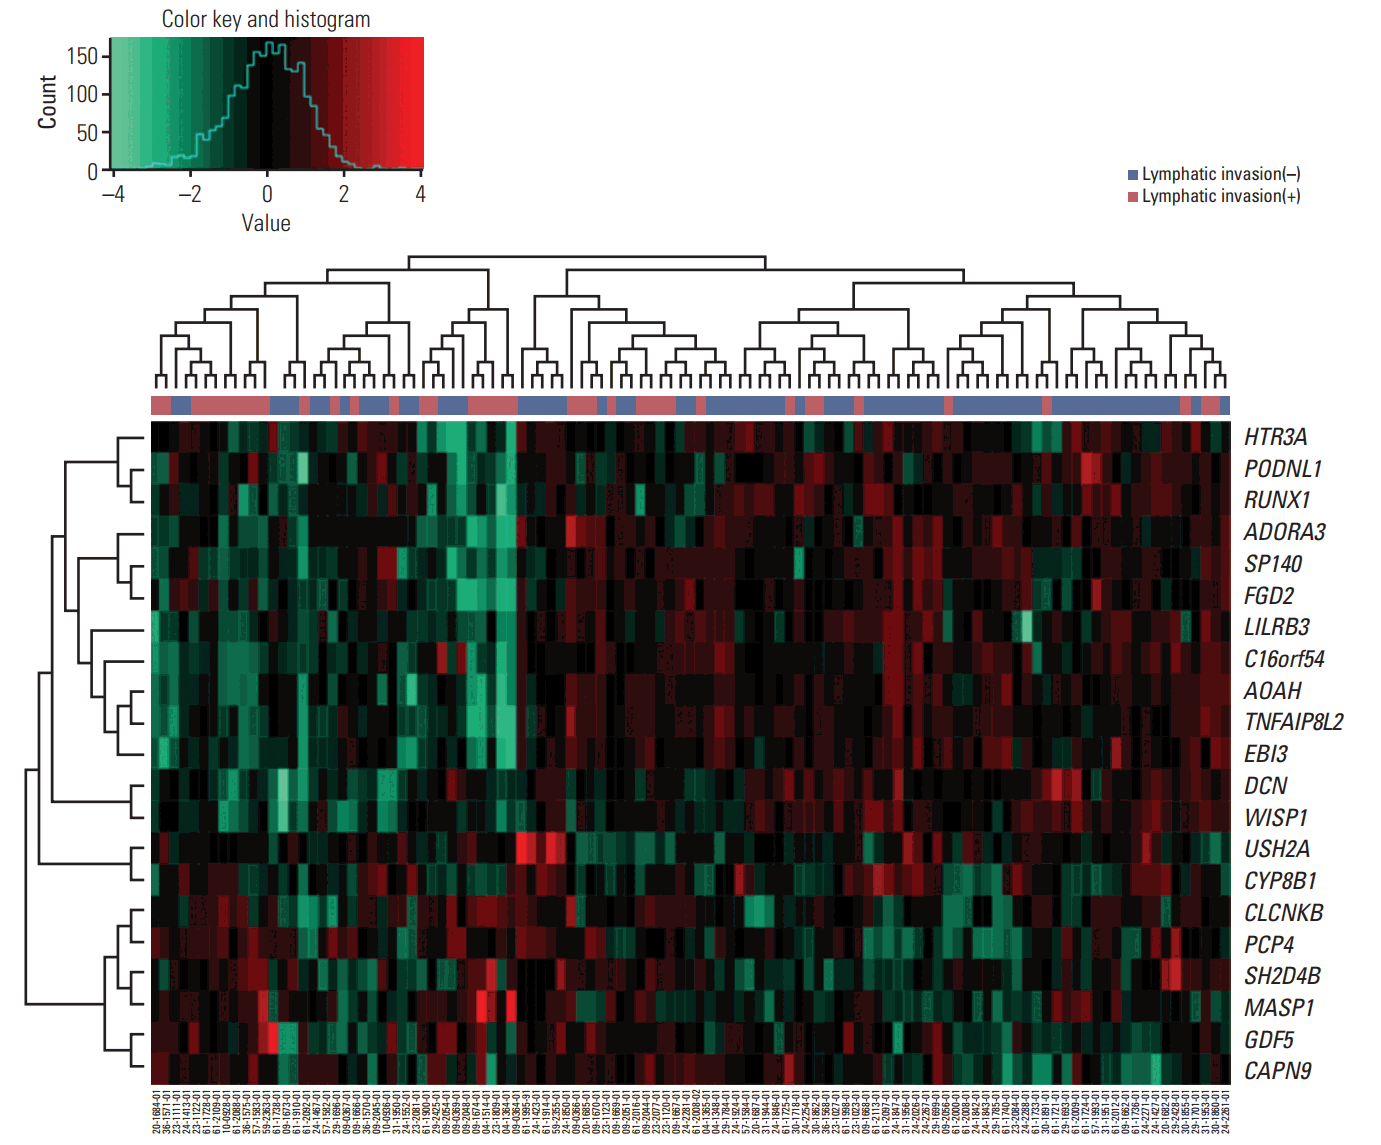
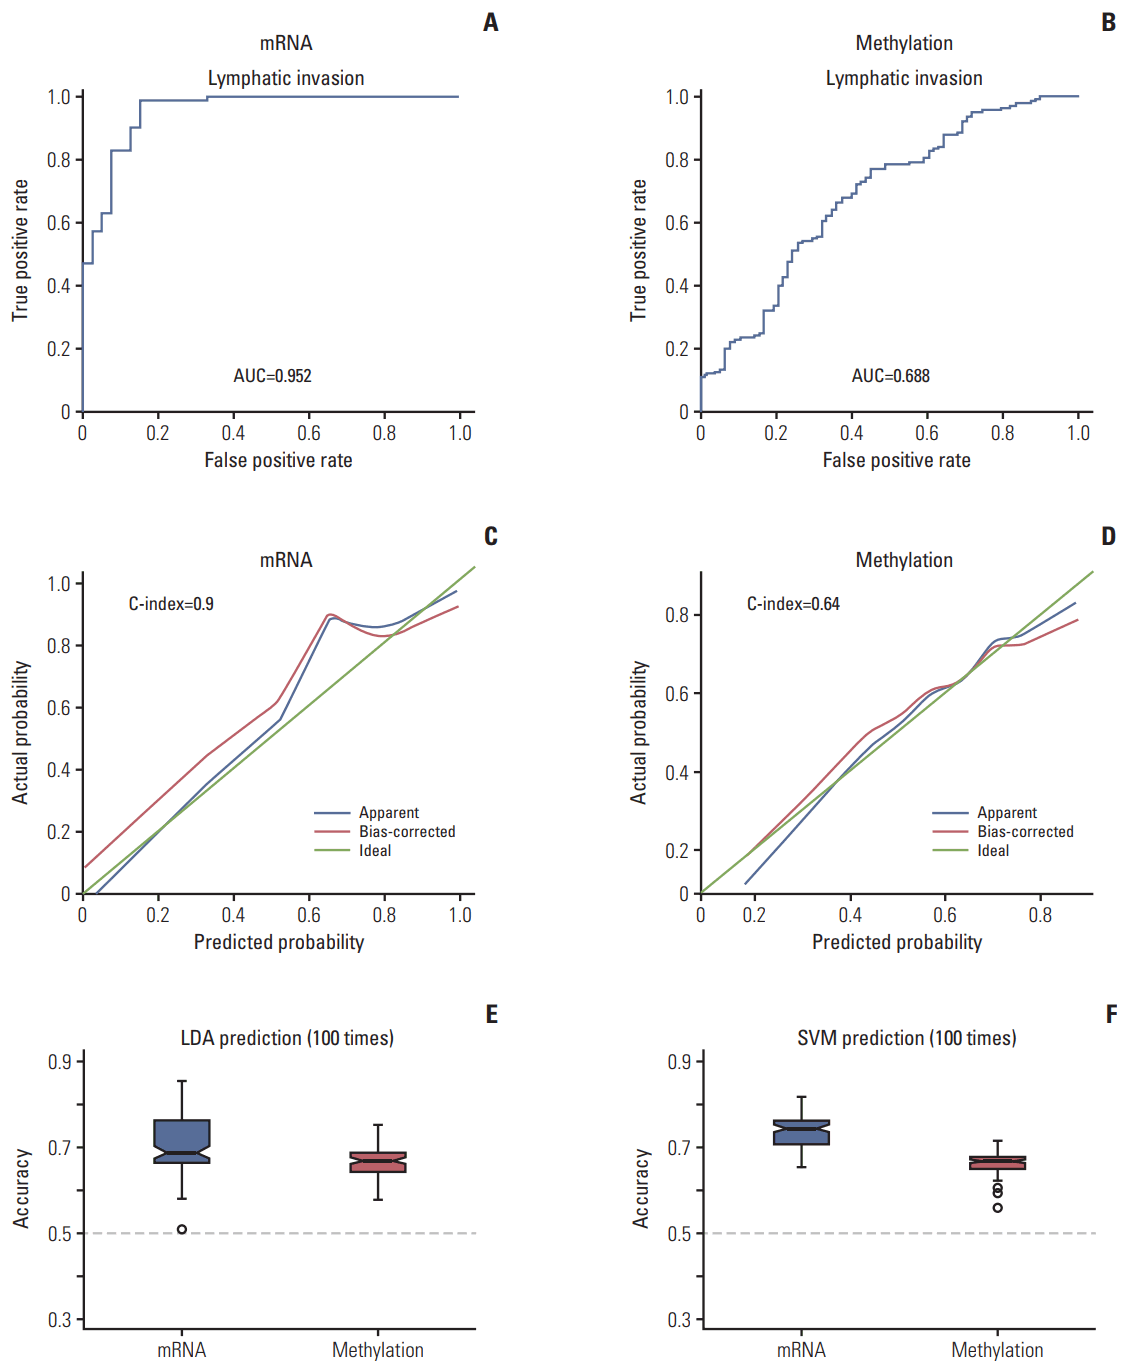
The clustering of samples using selected genes correlated well with lymphatic invasion status (Fig. 2). We performed ROC analyses to extract the performance of the prediction model. The average AUC value supports good performance of the model. The AUC values for the mRNA, and methylation models were 0.952 and 0.688, respectively (Fig. 3A and B). The gene expression data showed the best performance for the AUC of mRNA data compared with the other data sources (methylation data). For predicting lymphatic invasion, logistic regression, LDA, and SVM algorithm showed a high C-index in mRNA and methylation (Fig. 3C, E, and F).
3. Prediction analysis of PFS and OS with molecular signatures
To test whether genomic data can supply more prognostic power by combining with clinical factors, we created a RSF model by incorporating the clinical factors with each type of molecular signatures. Using a RSF model, our data showed that genomic data predicted PFS better than clinical variables, and the incorporated models showed significantly better predictive power for PFS compared to the clinical variable-only models (Fig. 4A, p < 0.001 and Fig. 4B, p=0.008). However, gene signature did not predict OS better than clinical variable model (Fig. 4C and D).
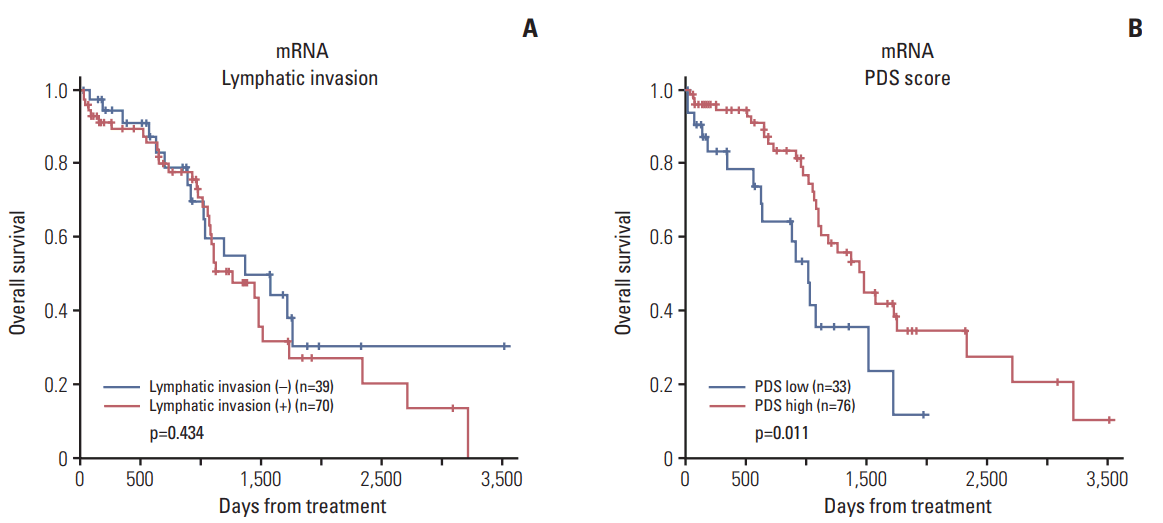
In addition, the Pathifier algorithm (PDS) divided patients into a high-risk and a low-risk group, which resulted in a statistically significant difference in OS with data for only mRNA (p=0.011) (Fig. 5). The survival of patients according to lymphatic invasion did not show a statistically significant association with OS. However, patients with a higher PDS showed better OS, indicating the prognostic significance of the molecular signature of lymphatic invasion. For PFS, the difference according to PDS score was not significant (data not shown).
4. External validation of classifier using microarray data of 26 ovarian cancer samples
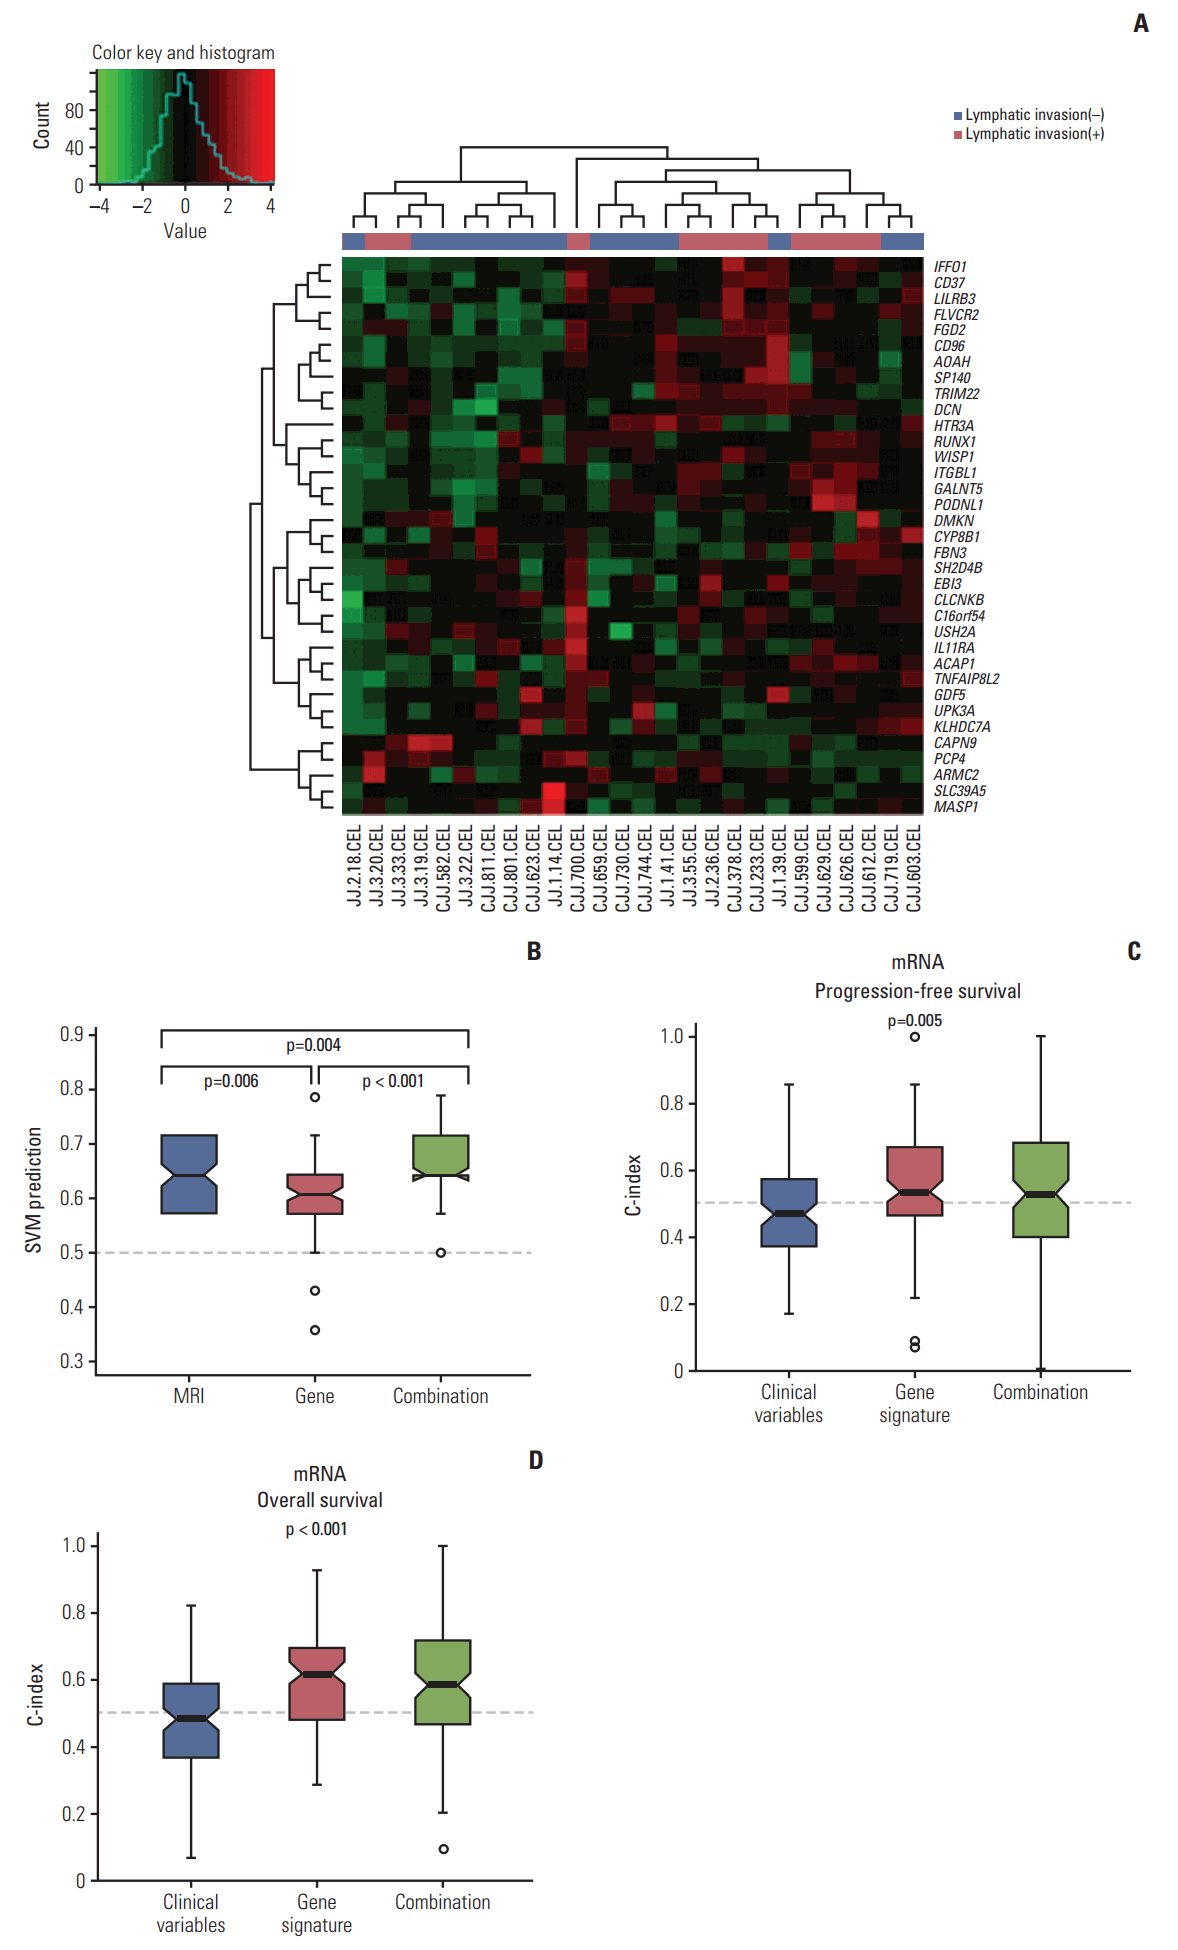
Fig. 6A shows hierarchical clustering of gene expression showing more frequent lymphatic invasion in cluster 1 (8/10) than cluster 2 (7/16). LDA and SVM algorithm showed a high C-index (median of 0.64 and 0.63, respectively) showing good performance of predicting lymphatic invasion. Additionally, we compared the prediction accuracy of magnetic resonance imaging (MRI) and molecular signature in our patient’s cohort (Fig. 6B). Molecular signature alone was inferior to preoperative MRI. However, the combination of MRI and gene signature showed higher prediction of lymphatic invasion.
Using a RSF model, incorporating molecular data and clinical variables improved the prediction of PFS and OS compared to using only clinical variables (age, FIGO stage, grade, residual disease status after primary debulking surgery, and lymphatic invasion) (p=0.005 and p < 0.001, respectively) (Fig. 6C and D). Meta-analysis of the gene expression data using curatedOvarianData database showed clinical significance of eight genes of 21 selected genes for OS (S3 Table and S4 Fig.).
Discussion
Until recently, not many gene expression–related molecular markers predicting prognosis had been developed for clinical field, and none of the currently known molecular signatures are generally used in clinical setting for EOC. In this study, we evaluated the prediction of lymphatic invasion and survival based on different level of genetic data types (mRNA and methylated DNA) for potential prognostic relevance and demonstrated the clinical use of large-volume molecular data in EOC. Integrating molecular data statistically increased the model performance compared with the clinical variable–only model.
The considerable effort for molecular characterization of cancer has been made through TCGA [24]. The TCGA research network presented number of papers on the analysis of gene expression and DNA methylation data for multiple cancers. By controlling and silencing gene expression through the interaction of methylcytosine binding proteins with other structural components of chromatin, DNA methylation contributes to cancer development [25]. mRNA also has an impact on gene expression and thus may have prognostic significance.
Cancer is the result of various steps in the biological system from genome to proteome, and a single fold of biological information may be insufficient for full explanation of tumor behavior or its mechanisms [14]. In this study, we applied analysis using multiple levels of molecular signatures (DNA methylation and mRNA expression) to the prediction of lymphatic invasion in EOC. The key point in this study is the increase in prognostic prediction by incorporating data from genomic data sources. To the best of our knowledge, this study is the first to assess the multiple molecular-based classifications of lymphatic invasion in EOC patients based on analysis of genomic and clinical features. Predicting lymphatic invasion using molecular classifier will enable physicians to reduce unnecessary invasive procedures and morbidity. In addition, molecular classifier also will be useful to make accurate prediction of prognosis. Possibly, after validation of the molecular classifier, using (easily obtainable) microarray and methylation chip could be applied to the clinical practice.
Lymphatic invasion is considered as a predictor of the aggressiveness of EOC. Interestingly, molecular signatures for lymphatic invasion was not significantly correlated with survival, but model predicting lymphatic invasion showed significant correlation with survival in our study. Possible reason would be addition of clinical variables in multivariate analysis during developing model. Also, degree of lymphatic invasion had been considered to be determinants for OS [8] which was not specifically classified by numbers for present study. In this study, we found that although information about the lymphatic invasion alone was not sufficient, it still can affect the efficiency of prediction using gene expressions.
For additional information, we found model for survival outcome (S5 and S6 Figs.), but the genes selected for survival outcome were different from the genes selected for lymphatic invasion. Also in meta-analysis of the gene expression data using curatedOvarianData database, only eight genes of 21 selected genes were significant. Representatively, RUNX1 is reported to be associated with female-related cancers as well as involved in female sex development and a crucial mediator of female hormone signaling [26]. CCN4 is aberrantly expressed in numerous cancer including ovarian cancer [27], and its transcript levels are lower in node-positive high-grade tumors and in patients with poor clinical outcome for breast cancer [28]. Low CAPN9 is associated with adverse disease-specific survival following endocrine therapy in breast cancer, and detection of ADORA3 was reported as a potential target for antibody-based therapy in p53 mutated tumors [29]. However, as mentioned earlier, molecular signatures for lymphatic invasion was not significantly correlated with survival possibly due to different pathophysiology that influenced the survival of the patients for each genes.
Our study has some limitations even though we offered novel concepts in the translation of molecular data to clinical practice. First, we used only data-mining process to creating prognostic model. We may have skipped some important clinical characteristics that could be distinguished by a previously known candidate gene. Second, engrafting multiple types of molecular data is technically challenging because of the problem with overfitting and extended co-linearity of large-volume biological data. Third, the clinical information from patient samples may not be appropriately accurate compared to information from large-scale clinical trials. Also, there were differences in data analyzing methods between internal and external cohort. For TCGA data analysis, RNAseqV2was used, but for external cohort, microarray (AffymetrixGeneChip Human Gene 1.0 ST oligonucleotide arrays) was used. RNA sequencing is known to provide increased specificity and sensitivity, enhanced detection of differential expression compared to microarray method. Inaccurate comparison may have been made. And lastly, the required time for the coordinated analysis described in this study is important for the clinical applications [30], which is expected evolve in near future. Thus, further investigations, such as external validations with large-scale clinical trial–level follow-up, are needed to validate our results.
In conclusion, our study showed that molecular signatures (mRNA and methylated DNA) based on lymphatic invasion improved prognostic stratification for EOC patients. Incorporating molecular data statistically increased the predictability compared with the model based only on the clinical variable. The signatures require further investigation to generate clinical-level prognostic analysis.