Introduction
Surgeon expertise has a great impact on the treatment outcome of cancer surgery, and on surgical morbidity [1-3]; the expertise of the radiation oncologist presumably has the same impact on outcome and morbidity in radiotherapy (RT), but this has not been well documented. To practice “state of the art” RT, a radiation oncologist should have knowledge of the natural history of the disease, proper incorporation of multimodal images, and cross-sectional anatomy; they should also be able to precisely delineate target volume, develop an optimal treatment plan with an adequate dose to the target volume, avoid critical organs, and accurately deliver the daily treatment. RT with insufficient target coverage and an excessive dose to critical organs can result in lower loco-regional control, a higher incidence of late toxicity, and poorer survival outcome. Therefore, substantial knowledge and experience are required to provide high quality RT. Differences in the knowledge and experience among providers can make a difference in the outcome of RT [4-6] in patients with head and neck cancer, particularly in the era of three-dimensional-conformal RT (3D-CRT) or intensity-modulated RT (IMRT). However, there is substantial heterogeneity in target volume delineation and clinical practice among radiation oncologists [5], depending on their experience and knowledge. Therefore, we postulated that the experience of a radiation oncologist, as indexed by hospital case volume (HCV), might have an impact on treatment outcome in patients with nasopharyngeal cancer (NPC).
NPC arises from anatomically challenging region, but is highly radio-curable disease, which makes RT with or without chemotherapy the mainstay of treatment [7]. Thus, NPC might be a good candidate disease to evaluate the impact of radiation oncologists’ experience on treatment outcome. We retrospectively investigated the effect of HCV on overall survival (OS) and loco-regional progression-free survival (LRPFS) in patients with NPC enrolled in a retrospective multi-center trial (Korean Radiation Oncology Group [KROG] 11-06).
Materials and Methods
1. Data source and study population
We collected the data of patients with cT1-4N0-3M0 NPC from a NPC study database (KROG 11-06). KROG 11-06 was a retrospective multi-center trial which included 14 institutions that reviewed the NPC pattern of care and treatment outcomes in patients with primary NPC treated from September 1988 to October 2011 [8]. The inclusion criteria were histologically confirmed NPC, cT1-4N0-3M0 disease according to the seventh editions of Union for International Cancer Control/American Joint Committee on Cancer (UICC/AJCC) staging classification. At the time of data collection, patients who had no baseline clinical information or had never completed RT were excluded from data collection. All patients on the data base were included for this analysis. Computational tomography was routinely done in all institutions for staging assessment. Magnetic resonance image (MRI) or positron emission tomography (PET) was also used for staging in some institutions.
After excluding patients treated with two-dimensional (2D) RT, 1,073 patients were analyzed. All patients received definitive RT either with 3D-CRT (n=576) or IMRT (n=497). The mean (±standard deviation [SD]) total 3D-CRT dose was 67.99±2.64 Gy in 38.0±2.8 fractions with a median fraction size of 1.80 Gy (range, 1.50 to 2.40 Gy). The mean±SD total dose for IMRT was 69.49±3.18 Gy in 31.8±3.4 fractions with a median fraction size of 2.25 Gy (range, 1.8 to 3.0 Gy), reflecting use of the concomitant boost technique.
2. Primary endpoint and covariates
To investigate associations between treatment outcome and institutional volume, the institutions were divided into high volume institutions (HVI) and low volume institutions (LVI) (S1 Table). The number of patients treated per year was calculated by dividing the total number of patients by the total period over which the patients were treated at each institution and it ranged from 2 to 18. HVI was defined as patient volume ≥ 10 patients per year (median, 13; range, 10 to 18) and LVI as patient volume < 10 patients per year (median, 3; range, 2 to 6). Ten patients per year was chosen as cut-point because there was the largest gap between the two consecutive values of 10 and 6. A total of 750 patients were treated at 4 HVIs and 323 were treated at 10 LVIs.
The endpoints of this study were OS and LRPFS, which were defined as the time from the start of RT to the time of death from any cause (OS), and persistence or recurrence in the nasopharynx or neck (LRPFS). Patients who had lost to follow-up were censored at the time of their last follow-up. The variables analyzed were age, Eastern Cooperative Oncology Group (ECOG) performance status (PS), World Health Organization (WHO) histologic type, TN category, stage grouping, the utilization of MRI or PET for staging, concurrent chemo-radiotherapy (CCRT; yes or no), RT modality (3D or IMRT), and institutional case volume (HVI or LVI).
3. Statistical analysis
Baseline characteristics of the patients treated at HVI and LVI were compared with the t test for continuous variables and the chi-square test for categorical variables. The Kaplan-Meier method was used to assess event-time distributions and the log-rank test was used to compare the event-time distributions between the two groups. In both the univariate and multivariate analyses, a p < 0.05 was considered significant. A Cox proportional hazard model was used with stepwise backward linear regression, where only variables whose p-values were > 0.10 were removed and used in multivariate analyses. Since there was significant imbalance in patient characteristics between HVI and LVI, propensity score matching analysis was done to reduce bias due to confounding variables. The propensity score was estimated using a logistic regression model including variables of age, ECOG PS, WHO histologic classification, TN category, stage group, RT modality (3D or IMRT) and concurrent chemotherapy (yes or no).
Results
1. Patient characteristics and survival of the cohort before propensity score matching
The patient and treatment characteristics stratified by HVI and LVI are summarized in Table 1. The median follow-up time was 56.7 months (range, 0 to 244 months). Median age was older in patients treated at HVI versus LVI. A lower proportion of patients treated at HVI had WHO histologic grade III tumors (45.7% vs. 59.1%, p < 0.001). MRI and PET were more frequently used for staging in patients treated at HVI than at LVI (MRI, 67.8% vs. 30.6%, p < 0.001; PET, 45.0% vs. 20.9%, p < 0.001, respectively). HVI were more likely to treat patients with IMRT than 3D-CRT (52.1% vs. 32.8%, p < 0.001). A total of 304 patients died. Fig. 1 shows the Kaplan-Meier survival curves for both groups. The OS was significantly higher in HVI than LVI for the cohort before propensity score matching (5-year, 78.1% vs. 62.5%; 10-year, 69.7% vs. 47.9%; p < 0.001). HVI was associated with higher OS compared with LVI in the multivariate Cox regression model (hazard ratio [HR], 0.48; 95% confidence interval [CI], 0.38 to 0.61; p < 0.001) (Table 2). Other variables significantly associated with OS were age, PS, WHO histologic classification, and TN category.
2. Patient characteristics and survival of the cohort after propensity score matching
A propensity score matching analysis was performed to reduce bias due to confounding variables. Of the patients treated at LVI, 307 were matched with 307 patients treated at HVI. Table 3 shows the patients characteristics for the propensity score-matched cohort. Variables including age, WHO histologic classification, and RT modality (3D-CRT vs. IMRT) were well-balanced between the two groups after propensity score matching.
A total of 196 patients died at a median follow-up of 55 months. As shown in the Kaplan-Meier survival curves for both groups in the propensity score-matched cohort (Fig. 1), OS was significantly higher in HVI than LVI (5-year, 78.4% vs. 62.7%; 10-year, 71.6% vs. 47.0%; p < 0.001, respectively). The multivariate Cox regression revealed that HVI was associated with higher OS than LVI, with an estimated HR of 0.43 (95% CI, 0.32 to 0.57; p < 0.001). Other variables associated with OS in multivariate analysis were age, PS, WHO histologic classification, and stage group (Table 4).
As shown in Fig. 1, LRPFS was significantly higher in HVI than in LVI (5-year, 86.2% vs. 65.8%; 10-year, 80.9% vs. 63.0%; p < 0.001). The LRPFS difference remained significant in favor of patients treated at HVI in the multivariate analysis (HR, 0.34; 95% CI, 0.23 to 0.49; p < 0.001). Other variable associated with LRPFS was T category (Table 4).
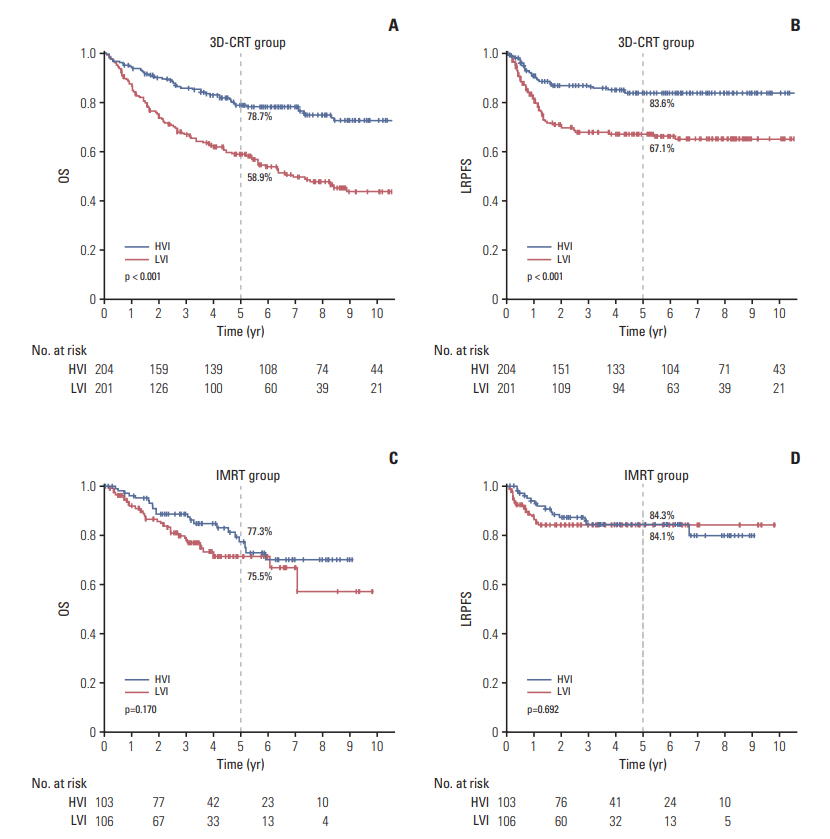
To determine the impact of RT modality, the propensity score-matched cohort was divided into 3D-CRT and IMRT groups. Significant differences in OS (5-year OS, 78.7% for HVI vs. 58.9% for LVI; p < 0.001) and LRPFS (5-year LRPFS, 83.6% for HVI vs. 67.1% for LVI; p < 0.001) were observed in the 3D-CRT group (Fig. 2). No differences in OS (5-year OS, 77.3% for HVI vs. 75.5% for LVI; p=0.170) or LRPFS (5-year LRPFS, 84.3% for HVI vs. 84.1% for LVI; p=0.692) were observed in the IMRT group (Fig. 2).
3. Toxicity
Acute grade ≥ 3 toxicities occurred less frequently in patients treated at HVI than those treated at LVI: hematologic toxicity (3.1% vs. 19.2%, p < 0.001), mucositis (18.4% vs. 22.0%, p=0.003), and xerostomia (0.9% vs. 9.0%, p < 0.001). Xerostomia ≥ grade 2 at 2 years after treatment was more frequently reported in patients treated at HVI than those treated at LVI (13.0% vs. 7.4%, p=0.046). However, this difference was not statistically significant in the propensity score-matched cohort (12.5% vs. 8.0%, p=0.126, respectively) (Table 5). Other late toxicities were reported in less than 3% of patients and the incidences were comparable between HVI and LVI. Two patients (0.3%) in HVI and eight patients (2.5%) in LVI died of treatment related toxicity.
Discussion
This study demonstrated a significant relationship between institutional volume and long-term outcomes of NPC. A higher institutional volume was associated with higher OS (HR, 2.09; 95% CI, 1.65 to 2.64; p < 0.001) and LRPFS (HR, 2.22; 95% CI, 1.69 to 2.91; p < 0.001). This difference remained significant after adjusting for covariates in the multivariate and propensity score matching analyses. These findings are consistent with other studies evaluating the volume effect in patients treated with definitive RT at diverse cancer sites, including high-risk prostate cancer, locallyadvanced lung cancer, and NPC [9-12].
Wuthrick et al. [13] performed a secondary analysis of the RTOG 0129 stage III-IV head and neck cancer RT trial, in which all patients received definitive RT with IMRT, and reported a greater risk of death in patients treated at historically low-volume accrual centers (HR, 1.91; 95% CI, 1.37 to 2.65). Boero et al. [14] published the results of a retrospective analysis of 6,212 patients with head and neck cancer using the SEER-Medicare database. They found a significant relationship between provider volume and survival only for patients receiving IMRT (HR, 0.79; 95% CI, 0.67 to 0.94), but not for patients receiving conventional non-IMRT [14]. However, it is difficult to compare these results with ours because the two studies included only a small proportion of NPC cases (0%-2%) and the latter study also enrolled 35% patients who underwent surgery prior to RT. Only one other study included patients with NPC; Lee et al. [12] retrospectively analyzed the Taiwan National Health Insurance Research Database data of 1,225 patents treated between 1998 and 2000. They found that patients treated by high-volume physicians had a 14% relative improvement in adjusted 10-year survival rate (high-volume vs. low/medium-volume physicians, 75% vs. 61%; p < 0.001). However, no information was given about the impact of RT modality on outcome.
Surprisingly, the analysis of the impact of RT modality on outcome showed that there was a significant relationship between institutional volume and survival only for patients receiving 3D-CRT (5-year OS, 78.7% for HVI vs. 58.9% for LVI; p < 0.001) and not for those receiving IMRT (5-year OS, 77.3% vs. 75.5%; p=0.170). In contrast, Boero et al. [14] demonstrated a significant relationship between provider volume and survival only for patients receiving IMRT and not for those receiving conventional RT, including 2D- and 3D-CRT. The reason for this discrepancy is not clear but one potential explanation might be that IMRT was first introduced to Korea in 2001. Around this time, many guidelines were published to help target delineation in head and neck cancers. In addition, many educational sessions were provided by the Korean Society for Radiation Oncology to educate society members on how to contour targets and evaluate treatment plans, which was not available for 3D-CRT. These efforts may have had a standardizing effect on practice; thus, no differences were found in outcome between HVI and LVI, as a result of substantial improvement in LVI, approaching that of HVI in the IMRT era. Notably, the 5-year OS rates improved from 58.9% with 3D-CRT to 75.5% with IMRT in the LVI, whereas they were similar at 78.7% for 3D-CRT and 77.3% for IMRT in the HVI. Thus, the standardization of practice by education might have a role for improvement of outcome in LVI.
The experience of a radiation oncologist as indexed by HCV might be one explanation for the survival advantage in patient treated at a HVI, as shown here. RT is a primary treatment for NPC, and a loco-regional control rate ≥ 90% can be achieved with contemporary IMRT techniques [7,15]. However, NPC treatment is complex. Several confounding factors influence the survival advantage in patients treated at a HVI. The utilization of advanced imaging studies including MRI and PET scans are helpful for accurate staging and target delineation for RT planning, which might improve treatment outcome. In this study, MRI and PET were performed twice more frequently at HVI than at LVI which might influence the better outcome at HVI. In univariate analysis, the OS and LRPFS were significantly associated with the utilization of PET (yes vs. no) (5-year OS, 78.7% vs. 70.6%; p=0.012; 5-year LRPFS, 82.0% vs. 74.5%; p=0.010, respectively), whereas they were not associated with the utilization of MRI. In multivariate analysis, the utilization of PET, however, became insignificant. Concurrent chemotherapy is also crucial for locallyadvanced NPC based on its survival benefit, as shown in multiple randomized-controlled trials and meta-analyses [16,17]. Given the complexity of the treatment for NPC, a multidisciplinary approach is recommended to improve long term survival and decrease long term toxicity. A HVI is likely to involve a multi-disciplinary team with more experienced radiologists, medical oncologists, radiation oncologists, and other supporting personnel, which might result in better outcomes. Acute toxicities > grade 3 were more frequently reported in LVI and treatment related mortality was also higher in LVI, which could have attributed to lower survival outcome in LVI. However, their impact on survival outcome could not be investigated because of the retrospective nature of the study.
Some limitations of our study should be mentioned. First, the effect of non-RT factors was not fully controlled due to the inherent shortcomings of a retrospective study. Detailed information about the chemotherapy regimen, number of cycles, and use of neo-adjuvant vs. adjuvant chemotherapy were not available in all patients. Nevertheless, most patients were given CCRT (75%) and this proportion was well-balanced between HVI and LVI. Given the lack of the information about socioeconomic status, there was the possibility of selection, in which patients with a higher socioeconomic status and good overall health may have visited HVI and sought expert opinions, which might have influenced the outcome.
The current study also had strengths. First, we included a large cohort comprised only of patients with NPC. This homogeneity made it easier to specifically interpret the impact of HCV on NPC outcomes. Second, we used a database for this retrospective study (KROG 11-06), which contained data on all patients who met the inclusion criteria (cT1-4N0-3M0, previously untreated NPC), thus including nearly all patients treated at each institution. In contrast to a national insurance database, these data included detailed information about the clinical status and treatment of each patient.
Our results are unique because the HCV was more influential for patients receiving 3D-CRT than IMRT, which contradicts previous studies [13,14]. More importantly, our data suggest that the difference in outcome between HVI and LVI can be overcome potentially by the standardization of practice. A significant relationship was observed between HVI and LVI for the clinical outcomes of patients with NPC. However, the difference in outcome becomes insignificant in the IMRT era, probably due to the standardization of practice by education.