Trends and Clinical Characteristics of Next-Generation Sequencing–Based Genetic Panel Tests: An Analysis of Korean Nationwide Claims Data
Article information

Abstract
Purpose
In the modern era of precision medicine, next-generation sequencing (NGS) is employed for a variety of clinical purposes. The aim of this study was to investigate the trends and clinical characteristics of NGS testing in South Korea.
Materials and Methods
This nationwide, population-based, retrospective cohort study examined National Health Insurance Service claims data from 2017 to 2021 for NGS and from 2008 to 2021 for gene-targeted anticancer drugs.
Results
Among the total 98,748 claims, there were 51,407 (52.1%) solid cancer panels, 30,173 (30.5%) hereditary disease panels, and 17,168 (17.4%) hematolymphoid cancer panels. The number of annual claims showed a persistent upward trend, exhibiting a 5.4-fold increase, from 5,436 in 2017 to 29,557 in 2021. In the solid cancer panel, colorectal cancer was the most common (19.2%), followed by lung cancer (18.8%). The annual claims for targeted cancer drugs have increased 25.7-fold, from 3,932 in 2008 to 101,211 in 2020. Drugs for the treatment of lung cancer accounted for 488,819 (71.9%) claims. The number of patients who received non-hereditary NGS testing has substantially increased, and among them, the count of patients prescribed targeted anticancer drugs consistently rose from 508 (13.9%) in 2017 to 2,245 (12.3%) in 2020.
Conclusion
This study highlights the rising nationwide demand for comprehensive genetic testing for disease diagnosis and treatment following NGS reimbursement by the National Health Insurance in South Korea, in addition to the need for greater utilization of targeted anticancer drugs.
Introduction
Next-generation sequencing (NGS) emerged in the early 2000s, allowing the simultaneous sequencing of tens to hundreds of genes. Notably, this method represents a cheaper and more time-efficient alternative to Sanger sequencing, thus enabling rapid and accurate genome analysis [1,2]. NGS-based targeted sequencing is extensively employed in the clinic, mainly for the detection of mutations causing hereditary diseases, which is achieved through germline mutation–related panel tests. Moreover, somatic mutation panel testing can be used to diagnose and classify cancers, identify driver oncogenes, develop targeted treatments, as well as to detect mutations that influence drug sensitivity and, consequently, patient prognosis [3,4].
The 2022 provisional clinical opinion of the American Society of Clinical Oncology recommends that all patients with metastatic or advanced solid cancer be tested using a multigene panel, such as NGS [5]. NGS was granted approval as a companion diagnostic by the U.S. Food and Drug Administration in 2017. In March 2018, the U.S. Center for Medicare & Medicaid Services added an NGS-based genetic panel test to the National Coverage Determination Plan for patients with advanced solid cancer [6]. In Europe, public health insurance refunds for NGS have now been introduced in Germany, France, the Netherlands, and the United Kingdom [7]. National medical insurance benefits in Japan also include NGS-based genetic panels for advanced cancer patients since 2019.
Starting on March 1, 2017, the Republic of Korea introduced conditional benefits within the National Health Insurance Service (NHIS) for genetic panel tests utilizing NGS technology. This insurance benefit is only approved if the test is conducted by an authorized institution that meets specified criteria, such as having appropriate facilities, personnel, and equipment. Genetic panel tests are conventionally categorized into hereditary and non-hereditary panels based on the targeted disease and must include essential genes required for the panel. If the eligibility criteria for insurance benefits are satisfied, a 50% co-payment rate is applied. Medical fees are classified into levels I or II based on differences in testing costs derived from variations in gene number and length. For example, non-hereditary panels are categorized as level I if they contain 5-50 genes or if the gene length is ≤ 150 kb, whereas all panels that exceed these limits are classified as level II. If the panel includes RNA-sequencing of the fusion genes, an additional 10% charge is also added to the fee. Reimbursement for hereditary or non-hereditary panels can be applied once per disease. The additional inclusion of a non-hereditary panel is permitted in cases of recurrence or failure to respond to treatment.
Although insurance benefits for NGS were introduced relatively early in Korea, nationwide research on their use is currently lacking. In the present study, we aimed to examine the utilization of NGS tests in Korea by analyzing NHIS claims data from a 5-year period (2017-2021). Furthermore, the correlation between NGS and claims for targeted cancer drugs was investigated, thereby providing valuable insights for policy-making with regard to NGS.
Materials and Methods
1. Data sources and participants
A total of 97% of the South Korean population benefits from the National Health Insurance (NHI) program and pays insurance premiums according to their income levels or property values. The remaining 3% are Medical Aid recipients [8]. We obtained data from customized research database sourced from the National Health Information Database (NHID), which covered the period between 2017 and 2021 for NGS, as well as from between 2008 and 2021 for targeted cancer drugs. However, 2021 data were incomplete due to the ongoing collection of claims data.
2. Study design and statistical analysis
Various aspects of claims related to NGS, including number of claims, test types, patient characteristics, and regional distribution, were examined. The NHI categorizes individuals into 20 income groups. Accordingly, patients were divided into upper-, middle-, and lower-income groups for income level analysis.
The primary purpose of NGS in cancer diagnosis is to identify mutations that could potentially respond to targeted therapy (TT) and thus establish personalized treatment regimens. Therefore, we examined trends on the use of targeted anticancer drugs that were reimbursed for patients with specific mutations. Data on the main active compound codes of TT administered to patients with alterations in epidermal growth factor receptor (EGFR) mutation (gefitinib, erlotinib, afatinib, etc.), anaplastic lymphoma kinase (ALK) and c-ros oncogene 1 (ROS1) rearrangement (crizotinib, ceritinib, alectinib, etc.), BRAF V600E mutation (dabrafenib and vemurafenib), BRCA mutation (olaparib and niraparib), CSF3R or JAK2 mutation (ruxolitinib), FLT3 mutation (gilteritinib), human epidermal growth factor receptor 2 (HER2) amplification (trastuzumab and pertuzumab), BCR/ABL rearrangement or KIT mutation (imatinib, dasatinib, nilotinib, etc.), RAS mutation (cetuximab), RET rearrangement (vandetanib), and promyelocytic leukemia/retinoic acid receptor alpha (PML/RARA) rearrangement (arsenic trioxide) were extracted. The RAS-related drug included in the analysis is cetuximab (EGFR monoclonal antibody), which is used for patients with colorectal cancer without KRAS and NRAS mutations. The numbers of TT claims pre- and post-March 2017 were evaluated using the interrupted time-series analysis method [9].
Data processing and statistical analyses were performed in SAS ver. 9.4 (SAS Analytics, Raleigh, NC) and R ver. 4.1.3 (R Foundation, Vienna, Austria). A chi-square test was conducted to identify the descriptive statistics and frequencies of the various factors. Statistical significance was set at p < 0.05.
Results
1. Characteristics of NGS-based genetic panel test claims
The total number of claims between 2017 and 2021 was 98,748. Although the 2021 claims data are not complete, the annual numbers increased consistently from 5,436 in 2017 to 29,557 in 2021, a 5.4-fold increase (Table 1, Fig. 1). Similarly, the number of NGS-approved institutions increased from 22 in March 2017 to 43 in December 2017, and reached 67 as of September 2022 (S1 Fig.).

Annual number of claims for next-generation sequencing testing

Annual number of claims for next-generation sequencing (NGS) testing. Note the 5.4-fold increase, surging from 5,436 in 2017 to 29,557 in 2021. Solid cancer level II is the most frequently used panel.
A total of 51,407 claims (52.1%) were of the solid cancer panel, 30,173 claims (30.5%) were of the hereditary disease panel, and 17,168 claims (17.4%) were of the hematolymphoid cancer panel. Level II solid cancer panel (48%) was the most common.
A total of 10,427 (10.6%) claims were made more than once, accounting for 21%, 8.4%, and 8.3% of hematolymphoid cancer, solid cancer, and hereditary disease panels, respectively (Fig. 2A, S2 Table). Among them, leukemia (2,633 cases, 25.2%) was the most common disease, followed by lung cancer (896 cases, 8.6%). The time interval between tests was the longest for the solid cancer panel, with an average of 287.9 days (median, 192 days), followed by the hereditary panel (average, 206.7 days; median, 60 days) and the hematolymphoid cancer panel (average, 179.4 days; median, 43 days).

Number of next-generation sequencing (NGS) claims according to the number of tests, RNA-sequencing, and department of test administration. (A) 10.6% claims were made more than once, representing 21% of the hematolymphoid cancer panel, 8.3% of the hereditary panel, and 8.4% of the solid cancer panel tests. (B) In total, 45.7% of the solid cancer panel and 8.5% of hematolymphoid cancer panel tests utilize RNA-sequencing. (C) The Department of Laboratory Medicine conducted 71,583 tests (72.5%) and the Department of Pathology conducted 27,152 tests (27.5%).
Additional RNA-sequencing analyses were performed for 24,976 patients (25.3%), accounting for 36.4% of the non-hereditary panel. RNA-sequencing analysis was performed on 23,517 cases (45.7%) of the solid cancer panel and 1,456 cases (8.5%) of the hematolymphoid cancer panel (Fig. 2B). However, it was rarely conducted for the hereditary panel (3 patients).
Based on the department in charge of NGS, the Department of Laboratory Medicine conducted 71,583 tests (72.5%), and the Department of Pathology conducted 27,152 tests (27.5%) (Fig. 2C). Most of the hereditary disease (99.1%) and hematolymphoid cancer (92.5%) panels were claimed as tests under the Department of Laboratory Medicine, while about a half of the solid cancer panel (49.8%) was claimed as tests under the Department of Pathology (Fig. 2C).
2. Patient characteristics of the NGS-based genetic panel test
The number of patients who underwent NGS was 5,319 in 2017 and 27,422 in 2021 (S3 Table). In the hereditary disease panel, psychobehavioral and neurodevelopmental disorders, such as epilepsy, ataxia, Parkinson’s disease, and myopathy, were the most common (6,723 patients, 22.3%). Hereditary neoplasms, such as breast and ovarian cancers, accounted for 1,155 patients (17.1%), whereas cardiovascular diseases, such as cardiomyopathy, arrhythmia, and moyamoya disease accounted for 1,941 patients (6.4%), while eye and ear diseases, such as retinal dystrophy and hearing loss, accounted for 1,517 patients (5%). The patients who were subjected to the hematolymphoid cancer panel had leukemia (n=7,861, 45.8%), myelodysplastic syndrome (n=1,865, 10.9%), myeloproliferative disease (n=1,697, 9.9%), and lymphoma (n=1,696, 9.9%). In the solid cancer panel, colorectal (9,871; 19.2%) and lung cancers (n=9,678, 18.8%) accounted for the highest distribution, with similar rates of occurrence (Table 2, Fig. 3).

Disease distribution of patients tested using next-generation sequencing

Disease distribution of patients who underwent next-generation sequencing testing. (A) In the hereditary disease panel, psychobehavioral and neurodevelopmental disorders are the most common diseases (22.3%). (B) In the hematolymphoid cancer panel, leukemia is the most common disease (45.8%). (C) In the solid cancer panel, colorectal (19.2%) and lung cancer (18.8%) account for the highest distributions.
The sex distribution was similar: 47,638 males (51%) and 45,681 females (49%). Regarding the ages of patients tested in the hereditary panel, 11,624 (40.3%) were < 20 years old. Comparatively, the age distribution for patients in the solid cancer panel was: 60s (n=15,176, 30.9%), 50s (n=12,204, 24.8%), 70s (n=9,566, 19.4%), 40s (n=6,030, 12.3%), and 80s (n=2,206, 4.5%), with a similar age distribution for the hematolymphoid cancer panel (Fig. 4, S4 Table).
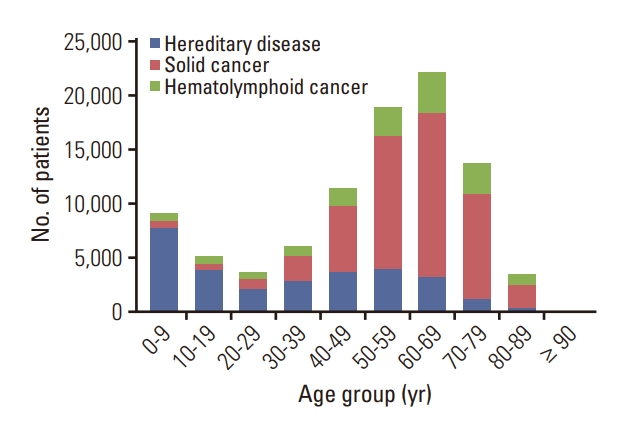
Age distribution of patients who underwent next generation sequencing testing according the type of panel. Patients under the age of 20 account for 11,624 (40.3%) in the hereditary panel. The age distribution of patients in the solid and hematological cancer panels is similar, with well over a half in their 50s to 70s.
With regard to the type of NHI, 64,008 (68.6%) were employed, 26,474 (28.4%) were self-employed, and 2,837 (3.0%) were individuals receiving Medical Aid. In 2020, the proportion of the total population covered by NHI was 70.3% for employed, 26.8% for the self-employed, and 2.9% for Medical Aid individuals, showing no significant difference from the distribution of patients who underwent NGS testing (p=0.599) (S5 Table) [10]. The income level of medical insurance patients showed a similar distribution, with 30,214 (34.2%) in the middle-, 29,493 (33.4%) in the upper-, and 28,656 (32.4%) in the lower-income group (p=0.322) (S5 Table).
Residential areas of patients accounted for 56% of the metropolitan area (Seoul [22.5%], Gyeonggi [26.9%], and Incheon [6.6%]) (S6 Table). Compared to that of all cancer patients registered in 2020, the residential distribution of patients in the non-hereditary NGS panel was greater within the metropolitan area (p < 0.001) and lower in Gyeongsang and Jeolla/Jeju area (p < 0.001), whereas there was no significant difference in Chungcheong (p=0.245) and Gangwon (p=0.456) areas (S7 Table) [11].
Tertiary general hospitals accounted for the majority of NGS-claiming institutions (88,026 claims, 89.1%), whereas the remainder comprised general hospitals (10,618 claims, 10.8%) or other institutions (97 claims, 0.1%). A total of 85.1% of NGS tests were performed in the metropolitan area and 62.7% of the institutions approved for NGS were located in the metropolitan area (S8 Fig).
3. Characteristics of gene-targeted anticancer drug claims
The number of annual claims for TT increased from 3,932 in 2008 to 101,211 in 2020 (Fig. 5A, S9 Table). EGFR-related drugs accounted for the largest proportion (n=433,032, 63.7%), followed by BCR/ABL- or KIT-related drugs (n=77,521, 11.4%), HER2-related drugs (n=57,408, 8.4%), ALK- or ROS1-related drugs (n=52,897, 7.8%), and RAS-related drugs (n=26,574, 3.9%). In 2019, claims for ALK/ROS1-targeting drugs exceeded those for BCR-ABL/KIT-targeting drugs. Moreover, drugs related to lung cancer accounted for 488,819 cases (71.9%), and hematological malignancies accounted for 102,458 cases (15.1%).

Number of claims for gene-targeted anticancer drugs (TT) according to drug type and age groups. (A) The number of annual claims for TT increases from 3,932 in 2008 to 101,211 in 2020, and EGFR-related drugs account for the largest proportion (63.7%). (B) The percentage of TT usage is low until 29 years of age (1.4%) and then it increases steadily until the ages of 60-69 (29.5%). Before the age of 40, BCR/ABL- and KIT-targeting drugs are the most common TTs, after which EGFR-related drugs account for the highest proportion.
The percentage of TT usage was low until 29 years of age, accounting for only 1.4% of all claims, then steadily increasing until the ages of 60-69 (29.5%). Through 39 years of age, BCR/ABL- and KIT-targeting drugs were the most common TT. After 40 years, EGFR-related drugs accounted for the highest proportion of TT (Fig. 5B, S10 Table).
Most patients who received TT were insured as employees (n=422,889, 62.2%), self-employed (n=214,940, 31.6%), and Medical Aid beneficiaries (n=42,151, 6.2%). This was notably higher than the rates of self-employment (26.8%) and Medical Aid (2.9%) across the national population. The distribution of health insurance beneficiaries who received TT according to income level was similar: lower (n=203,712, 32.6%), middle (n=211,805, 33.9%), and upper income (n=208,424, 33.4%). Most medical institutions that prescribed TT were tertiary general hospitals (n=519,783, 76.4%) and general hospitals (n=157,964, 23.2%).
When comparing the pre- and post-reimbursement periods of NGS (January 2016-March 2017 vs. March 2017-December to 2018), the number of TT claims increased by 12.8% following NGS reimbursement. In addition, the number of NGS claims per month increased with a gradient of 1.6% (trend) before reimbursement and increased with an additional gradient of 1.2% after reimbursement (trend after policy; p < 0.001) (S11 Table, S12 Fig.).
Among the patients prescribed TT, those who underwent NGS continued to rise from 697 (13%) in 2017 to 1,815 (31.3%) in 2020 (Fig. 6A). Among patients who underwent non-hereditary NGS, the number of patients prescribed TT increased steadily from 508 (13.9%) in 2017 to 2,245 (12.3%) in 2020. However, the rate declined slightly, except in 2018, as the number of tests for non-hereditary NGS increased significantly, outweighing the increase in patients prescribed TT (Fig. 6B).
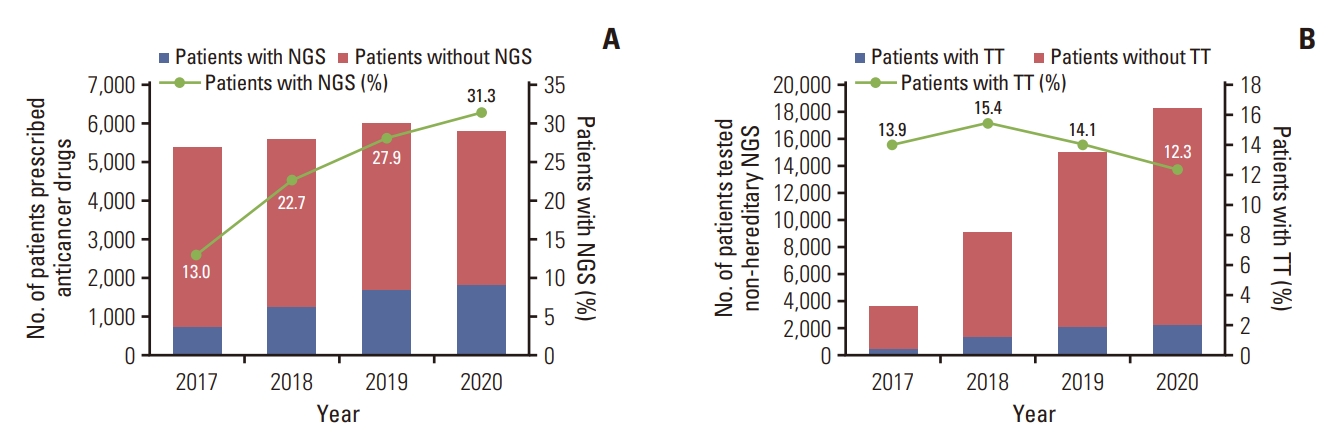
Utilization of gene-targeted anticancer drugs (TT) and next-generation sequencing (NGS). (A) Among patients prescribed TT, the number undergoing NGS tests continues to increase from 697 (13%) in 2017 to 1,815 (31.3%) in 2020. (B) Among patients who underwent non-hereditary NGS tests, the number of patients prescribed TT is increasing steadily. However, the rate declines slightly, except in 2018.
As a result of analyzing the disease distribution of patients who were prescribed TT among patients who underwent NGS tests by extracting the main disease code, lung cancer showed the highest frequency, at 25.7%, followed by colorectal cancer (17%), breast cancer (8.6%), leukemia (8.4%), stomach cancer (5.4%), and ovarian cancer (5%) (S13 Fig.).
Discussion
The number of NGS tests has increased consistently since the implementation of selective insurance benefits in South Korea. This reflects the increasing clinical demand for comprehensive genetic testing, such as through NGS, for the diagnosis and treatment of diseases, in line with advances in precision medicine. However, a corresponding increase in the proportion of patients prescribed TT was not observed in non-hereditary NGS-tested patients over time. It is attributable to low availability of “new TTs”, rather than lack of utility of non-hereditary NGS testing.
The proportion of cases that were claimed more than once was 10.6%, comprising 21% of the hematolymphoid cancer panel and 8% of both the solid cancer and hereditary panels. The need for additional NGS testing is more common in hematological malignancies owing to clonal evolution [12]. An investigation into Medicare Advantage prescription drug plan enrollees’ insurance claims data in the United States found that 12.8% of patients underwent ≥ 2 solid cancer panel examinations [13].
The number of patients subjected to testing with the solid cancer level I panel, which included < 50 genes, was very low (4.1%). The purpose of NGS testing in solid cancers is to identify genetic alterations that are druggable or patients that can participate in clinical trials. In addition, it can be used to identify tumor mutation burden (TMB) and microsatellite instability (MSI), which predict the effectiveness of cancer immunotherapy [14,15]. In particular, to detect newly discovered or rare genetic mutations, or to determine TMB and MSI, a broad range of genes and analysis scope are required within the panel, and many commercial panels currently used in clinical settings include hundreds of genes. One previous U.S. study showed that the use of larger panels (> 50 genes) has steadily increased from 20.7% in 2016 to 46.4% in 2018 [13].
When patients who underwent NGS were categorized based on their primary disease, the solid cancer panel revealed that colorectal, lung, and gastric cancers were the most frequently tested (in descending order). As per the cancer incidence statistics from 2019 in South Korea, lung, gastric, and colorectal cancer ranked second, third, and fourth, respectively [16]. Although brain tumors have a relatively low incidence (ranking 19th), they are the 4th most common tumor subjected to NGS testing. This is probably because the molecular characteristics have been increasingly incorporated into the diagnostic definitions of tumor classifications by the World Health Organization since 2016 [17]. Moreover, in the recently updated 2021 classification, the number of tumors that require genetic testing for final diagnosis and grading classification has increased further [18]. While the incidence of ovarian cancer was not high (ranking 17th), the demand for NGS testing is rising, as poly(ADP-ribose) polymerase inhibitors, a targeted anticancer drug that can be used in patients with BRCA mutations, are covered by the NHI [19]. Pancreatic and biliary tract cancer, along with cancers of an unknown primary site, are uncommon yet highly aggressive tumors, and NGS can be used to explore other treatment options available in such cases.
Among those tested with the solid and hematolymphoid cancer panels, the proportions of Medical Aid patients were 2.8% and 3.4%, respectively. Notably, these values are similar to those for the national population (2.9%). However, a previous study reported that the 2010 Medical Aid rate of patients with cancer in Korea (7.7%) was higher than that of the national population (3.3%) [20]. Likewise, in this study, we also found that the proportion of Medical Aid patients was higher among those who received TT (6.2%) than that for the general population (2.9%). Therefore, it is possible that NGS is performed less when compared with the relatively high rate of Medical Aid among cancer patients. In the United States, after the public health insurance for NGS was launched in 2018, it was found that disparities still exist due to factors such as type of health insurance, region of residence, and race [21].
The majority of healthcare institutions that submitted claims for NGS were tertiary hospitals, while many NGS-approved and NGS-claiming institutions are located within the metropolitan areas. This regional imbalance is probably because NGS is only feasible when selective reimbursement conditions are met, such as expensive equipment, skilled professionals, and laboratory requirements. It may also result from a combination of factors, such as the availability of NGS testing, the treatment capacity of hospitals, and opportunities for participation in clinical trials. In addition, considering 56% of patients who underwent NGS testing resided in the metropolitan area, while the location of medical institutions that claimed NGS is 85.1% in the metropolitan area, it can be inferred that many patients residing outside the metropolitan area are being referred to metropolitan tertiary hospitals for testing and treatment. Under the current regulations, NGS non-approved institutions cannot even entrust NGS to an approved institution; therefore, it is not possible to perform NGS without sending patients to approved institutions. Therefore, there is a need to adjust current regulations to allow outsourcing of NGS testing to laboratories that meet an adequate level of requirements, even if they do not meet all the requirements for NGS-approved institutions in terms of personnel and equipment.
The proportion of NGS-tested patients among patients prescribed TT has been increasing steadily. However, the proportion of patients prescribed TT among non-hereditary NGS-tested patients did not increase during the analysis period. This was because the increase in the number of TT-prescribed patients was lower than the increase in NGS-tested cancer patients. Although the number of claims and growth rate of TT increased when comparing pre- and postNGS reimbursement, patient access to new anticancer drugs in South Korea was relatively low compared to that in other developed countries. For example, the accessibility of new cancer drugs developed between 2011 and 2019 was 45% in Korea compared to 66% in A9 countries (United States, Canada, United Kingdom, France, Germany, Switzerland, Italy, Australia, and Japan), which are commonly used as a reference when determining new drug prices in Korea. Furthermore, the average drug lag was 14.8 months in A9 countries compared to 27 months in South Korea [22]. A study analyzing approved imported drugs in South Korea from 2000 to 2019 found that oncology drugs were 0.247 times less likely to receive approval than non-oncology drugs [23]. Therefore, the approval and insurance coverage of new anticancer drugs must be more actively pursued, while health policies should move to ease regulations on new drugs or clinical trials, thus encouraging investigator- or sponsor-initiated clinical trials. It is also necessary to prioritize and redistribute benefits for the continued support of national insurance finances, in addition to conducting an active re-evaluation process for expensive genetic tests, such as NGS, and new anticancer drugs.
The present study analyzed data from the NHID of South Korea, which may not fully reflect the clinical relevance and overall efficacy of NGS testing due to the exclusion of patients who underwent NGS testing or received TT through clinical trials or non-reimbursable treatments, leading to a potential underestimation. For example, the K-MASTER Project, a prospective study in which NGS was performed on 10,000 Korean cancer patients, was excluded from NHID [24]. In addition, 2021 data remain incomplete owing to the exclusion of cases for which claims have not yet been completed.
Novel therapies targeting genetic mutations are important for patients with advanced cancers, and NGS serves as a critical diagnostic link in this regard. Accordingly, health policies should move toward improving patient access to novel gene-targeted anticancer drugs, in parallel to the continued reimbursement of NGS under the NHI in Korea.
Electronic Supplementary Material
Supplementary materials are available at Cancer Research and Treatment website (https://www.e-crt.org).
Notes
Ethical Statement
All the procedures were in accordance with the Declaration of Helsinki. The National Health Insurance Service of Korea (no. NHIS-2022-1-603) and the Institutional Review Board of the National Health Insurance Service Ilsan Hospital (NHIMC 2022-05-006) approved this study and waived informed consent because all personal information used in the present study was anonymized.
Author Contributions
Conceived and designed the analysis: Park HY, Kim EK.
Collected the data: Park HY.
Contributed data or analysis tools: Jang M, Kim EK.
Performed the analysis: Park HY, Kim EK.
Wrote the paper: Jang M, Kim EK.
Critical revision of the manuscript for important intellectual content: Heo JY, Lim H, Choi YL, Shim HS.
Conflicts of Interest
Conflict of interest relevant to this article was not reported.
Acknowledgments
The National Health Information Database was provided by the National Health Insurance Service of Korea. The authors would like to thank the National Health Insurance Service for their cooperation. This work was supported by the National Health Insurance Service Ilsan Hospital [NHIMC-2022-PR-014] and the National Research Foundation of Korea (NRF-2022R1C1C1008494).