Functional Annotation and Gene Set Analysis of Gastric Cancer Risk Loci in a Korean Population
Article information

Abstract
Purpose
We aimed to identify the associated single nucleotide polymorphisms (SNPs) with gastric cancer (GC) risk by genome-wide association study (GWAS) and to explore the pathway enrichment of implicated genes and gene-sets with expression patterns.
Materials and Methods
The study population was comprised of 1,253 GC cases and 4,827 controls from National Cancer Center and an urban community of the Korean Genome Epidemiology Study and their genotyping was performed. SNPs were annotated, and mapped to genes to prioritize by three mapping approaches by functional mapping and annotation (FUMA). The gene-based analysis and gene-set analysis were conducted with full GWAS summary data using MAGMA. Gene-set pathway enrichment test with those prioritized genes were performed.
Results
In GWAS, rs2303771, a nonsynonymous variant of KLHDC4 gene was top SNP associated significantly with GC (odds ratio, 2.59; p=1.32×10−83). In post-GWAS, 71 genes were prioritized. In gene-based GWAS, seven genes were under significant p < 3.80×10⁻⁶ (0.05/13,114); DEFB108B had the lowest p=5.94×10⁻¹⁵, followed by FAM86C1 (p=1.74×10⁻¹⁴), PSCA (p=1.81×10⁻¹⁴), and KLHDC4 (p=5.00×10⁻¹⁰). In gene prioritizing, KLDHC4 was the only gene mapped with all three gene-mapping approaches. In pathway enrichment test with prioritized genes, FOLR2, PSCA, LY6K, LYPD2, and LY6E showed strong enrichment related to cellular component of membrane; a post-translation modification by synthesis of glycosylphosphatidylinositol (GPI)-anchored proteins pathway.
Conclusion
While 37 SNPs were significantly associated with the risk of GC, genes involved in signaling pathways related to purine metabolism and GPI-anchored protein in cell membrane are pinpointed to be playing important role in GC.
Introduction
Gastric cancer (GC) ranks the fifth most common type of cancer and fourth main cause of cancer-specific mortality worldwide [1]. The incidence of GC is highest in East Asian (EAS) countries including Japan, Korea, and China [1]. In 2018, the Korean Central Cancer Registry reported that the age-adjusted incidence rates of GC for all registrants, males and females were 30.4, 44.3, and 18.3 per 100,000, respectively [2]. Several etiological factors have been associated with the risk of GC including lifestyle factors, genetics, gut microbiome, and clinical factors [3,4]. Understanding the genetic basis of GC risk reveals insights into the pathogenesis of GC occurrence. Moreover, it offers a possibility to identify new genetic biomarkers and novel treatment targets [5].
In some studies, a genome-wide association study (GWAS) was performed and identified genetic variants associated with GC particularly in Asian countries [6–9], and single nucleotide polymorphisms (SNPs) in specific genes namely PSCA [6], PLCE7 [7], ZBTB20 [8], and DNAH11 [9] were pinpointed to have the possible associations. For a SNP, or a variant, to be potentially causal to interested phenotype or diseases, a variant should affect the related gene function in consequence of transcript expression or protein level difference. However, determining exact causal variant from the result is difficult since many of GWAS signals are from non-coding region [10] and the linkage disequilibrium (LD) structure complicates pinpointing the true causal variant [11]. In GWAS era, thousands of loci have been identified which are statistically associated with disease risk and notable number of these loci are well replicated, meaning that they are true associations [12]. However, several factors have made it difficult to bridge the gap between the statistical associations linking locus and trait and a functional understanding of the biology underlying disease risk [13]. Thus, in the field of functional genomics that may facilitate the derivation of biological meaning ‘post-GWAS’ is essential to address this gap.
‘Post-GWAS’ is to fine-tune the true causal variant and gene while verifying their genetic mechanism based on the GWAS result [14]. Thus, annotating the putative functional consequences of identified variants can give insight for concrete interpretation of GWAS result. Genetic variant may influence genes via protein-level functional disruption or expression. As significant SNPs from GWAS result are found to be enriched in regulatory region, integrating gene expression data is essential. Furthermore, gene or gene-set analysis can evaluate if a number of associated causal variants or genes converges to a specific pathway, also known as enrichment analysis [15]. It tests if a predefined gene set which includes genes that are in interest shows significant association with the trait compared to other gene sets.
While previous studies mainly focused on identifying casual variants and genes, Posthuma et al. developed an Internet-based program named FUMA v1.3.7 (https://fuma.ctglab.nl/) as a highly efficient, concise, and easy-to-use tool that can further explore GWAS data by utilizing multiple biological databases [16]. Therefore, we first identified the associated SNPs with GC in Korean population by GWAS. Then, we explored the pathway enrichment of implicated genes and gene-sets with expression patterns after prioritizing the genes by three gene mapping methods and functional annotation.
Materials and Methods
1. Study population
For GWAS analysis, genotypes from the National Cancer Center (NCC) and an urban community of the Korean Genome Epidemiology Study (KoGES) were used. From NCC, 450 GC cases and 1,134 healthy controls were sequenced using an Axiom Exome 319 chip (Affymetrix Inc., Santa Clara, CA) containing 696,169 polymorphisms. KoGES provided recruited samples of 803 GC cases and 3,693 healthy controls and genotyping was performed using an Affymetrix Genome-wide Human SNP Array 6.0 containing 4,470,730 polymorphisms. In total, 1,253 GC cases and 4,827 healthy controls were used.
2. Genome-wide association analysis
Standard quality control process and statistical analysis were performed using PLINK v.1.90. Variants with genotype call rate < 0.95 or different genotype call rate between cases and controls (p < 1×10⁻⁶) were removed. Then, variants which are deviated from Hardy-Weinberg equilibrium (p < 1×10⁻⁶), and showing minor allele frequency < 0.01 were filtered. After quality control in each population, samples were merged with 427,089 shared variants for further steps. The imputation of the genotype was performed of all filtered samples using Michigan imputation server. The 1000 Genome Project phase 3 East Asian Ancestry sample was used for a reference panel, and variants were filtered with INFO score above 0.8 with post quality control for imputed genotype remaining 1,487,410 total SNPs.
Finally, 6,080 individuals were used for association analysis. Given a case and control phenotype for GC with sex, age and two principal components as covariates, logistic regression analysis was performed under additive genetic effects assumption to identify the association between each SNP and GC status.
3. Functional annotation
Functional annotation was conducted with SNP2GENE implemented in FUMA (v1.5.1) [16]. Genomic risk loci were characterized based on the summary statistics from GC GWAS results and genetic reference data from EAS populations in 1000G phase3 [17]. First, ‘independent significant SNPs’ were identified based on their p-value < 5×10⁻⁸ and having moderate LD r2 < 0.6 in 1000G phase 3 EAS reference. Then, ‘lead SNPs’ were obtained as a subset of ‘independent significant SNPs’ with pairwise r2 < 0.1. Finally, ‘genomic loci’ were determined by including SNPs in LD with ‘independent significant SNPs’ with r2 > 0.6, and those included total SNPs were referred to ‘candidate SNPs’. The maximum distance between LD blocks to merge into a genomic locus was 250 kb. ‘Candidate SNPs’ also consist of SNPs in reference data, which might not be included in GWAS analysis.
Functional annotation was followed for all candidate SNPs in genomic loci. Their functional consequences on gene function were assigned by ANNOVAR (gene-based annotation using Ensembl genes), including CADD score (deleteriousness score) [18], potential regulatory functions from RegulomeDB (RDB) [19], effect on the gene expression using expression quantitative trait loci (eQTL) of different tissue types (GTEx v8) [20], and 15-core chromatin state predicted by ChromHMM [21] for 127 tissue/cell types from The Encyclopedia of DNA Elements (ENCODE) [22] and Roadmap Epigenomics Consortium [23].
4. Gene mapping
Annotated SNPs were subsequently mapped to genes and prioritized by two mapping approaches; (a) physical position on the genome (positional mapping), (b) eQTL associations (eQTL mapping), and (c) chromatin interaction mapping. Firstly, positional mapping filtered SNPs with CADD score over 12.37, suggested threshold for a deleteriousness score [18]. Then, genes in each genomic risk locus were determined by screened SNPs if the physical distance between a SNP and gene was < 10 kb. For eQTL mapping, SNPs were filtered by assigned RegulomeDB score under 7 as lower scores indicate higher potentiality of regulatory function. Then, SNPs were mapped to gene up to 1Mb apart if they show significant association on expression of the gene with false discovery rate < 0.05. Tissue types from three eQTL data repositories (Database of Immune Cell Expression [DICE] [24], eQTLGen [25], GTEx v8 [20] Colon and Stomach) were used. Lastly, chromatin interaction mapping is performed with significant chromatin interactions at threshold 0.05. Region 1 was defined as one end of a significant interaction that overlap with one of the candidate SNPs, and region 2 was another end of the significant interaction, and it was used for mapping for genes. Region 2 could also be overlapped with one of the genomic risk loci. Then, mapping was performed with mapped genes whose promoter region were overlapped with region 2, and those genes were considered as mapped by candidate SNPs that were in region 1.
Gene prioritization is based on a combination of functional gene mapping. Genes mapped by eQTL mapping may not be located inside a genomic risk locus. Thus, gene prioritization considered genes that are likely to have function in GC when overall mapping approaches across relevant tissue type pinpoint to same genes. Also, risk increasing allele in GWAS (defined allele with odds ratio [OR] > 1) and tested allele of eQTL were aligned.
5. Gene-based and gene-set enrichment analyses
The gene-based analysis and gene-set analysis were conducted with full GWAS summary data using MAGMA v1.07 [26] with default settings in FUMA. For gene-based analysis, SNPs were mapped to protein-coding genes if they are located in the gene, and the resulting p-values were combined into a gene test-statistic using the SNP-wise mean model. Then, Bonferroni correction for multiple testing was applied to all tested gene sets. For the gene-set analysis, 5,497 curated gene sets and 9,983 gene ontology (GO) terms were obtained from Molecular Signature Database (MsigDB) v7.0.
Furthermore, to identify tissue specificity of the GC, MAGMA performed gene-property analyses to test the relationships between tissue-specific gene expression profiles and GC associated genes. GTEx v8 [20] data was selected for gene expression data and EAS populations in 1000G phase3 [17] is used as a reference panel to calculate LD across SNPs and genes.
Rather than using all SNPs and genes, prioritized genes were tested for overrepresentation in various gene sets using hypergeometric test. All mapped genes were compared with gene set from public databases such as GWAS-catalog, MsigDB, and WikiPathways. The adjusted p-value threshold of the gene set was 0.05 with Benjamini-Hochberg correction, and at least two genes were overlapped to be reported for gene-set analyses.
Results
1. Genome wide association analysis and functional annotation
The study population was comprised of 1,253 GC cases and 4,827 controls with a mean age of 55.86 and 52.84, respectively (Fig. 1). After genotype imputation and quality control steps, the number of SNPs included in the GWAS was 1,487,410. A Manhattan plot for GWAS result is shown in Fig. 2A. Rs2303771, a nonsynonymous variant of KLHDC4 gene in chromosome 16, showed the most significant signals for association (OR, 2.59; p=1.32×10−83) along with intronic variants such as rs9940714, and rs66767559 in KLHDC4. Including a nonsynonymous variant rs7120658 of DEFB108B gene, numerous SNPs in chromosome 11 showed strong association, followed by SNPs in chromosome 8 with rs10087300 and rs2976384 which are located near PSCA gene. SNPs with significant signals are listed in S1 Table. As candidate SNPs were dense around risk locus, regional plots for chromosome 11 and 8 are shown in S2 Fig.

Overall workflow. Starting from gastric cancer genome-wide association study (GWAS) with total 6,080 samples, functional annotation of identified single nucleotide polymorphisms (SNPs) across 6 genomic risk loci, 71 genes prioritized by positional, expression quantitative trait loci (eQTL), and chromatin interaction gene mapping approaches, and gene-based analysis with all genes and prioritized genes for further biological pathway understanding. KoGES, Korean Genome Epidemiology Study; NCC, National Cancer Center.
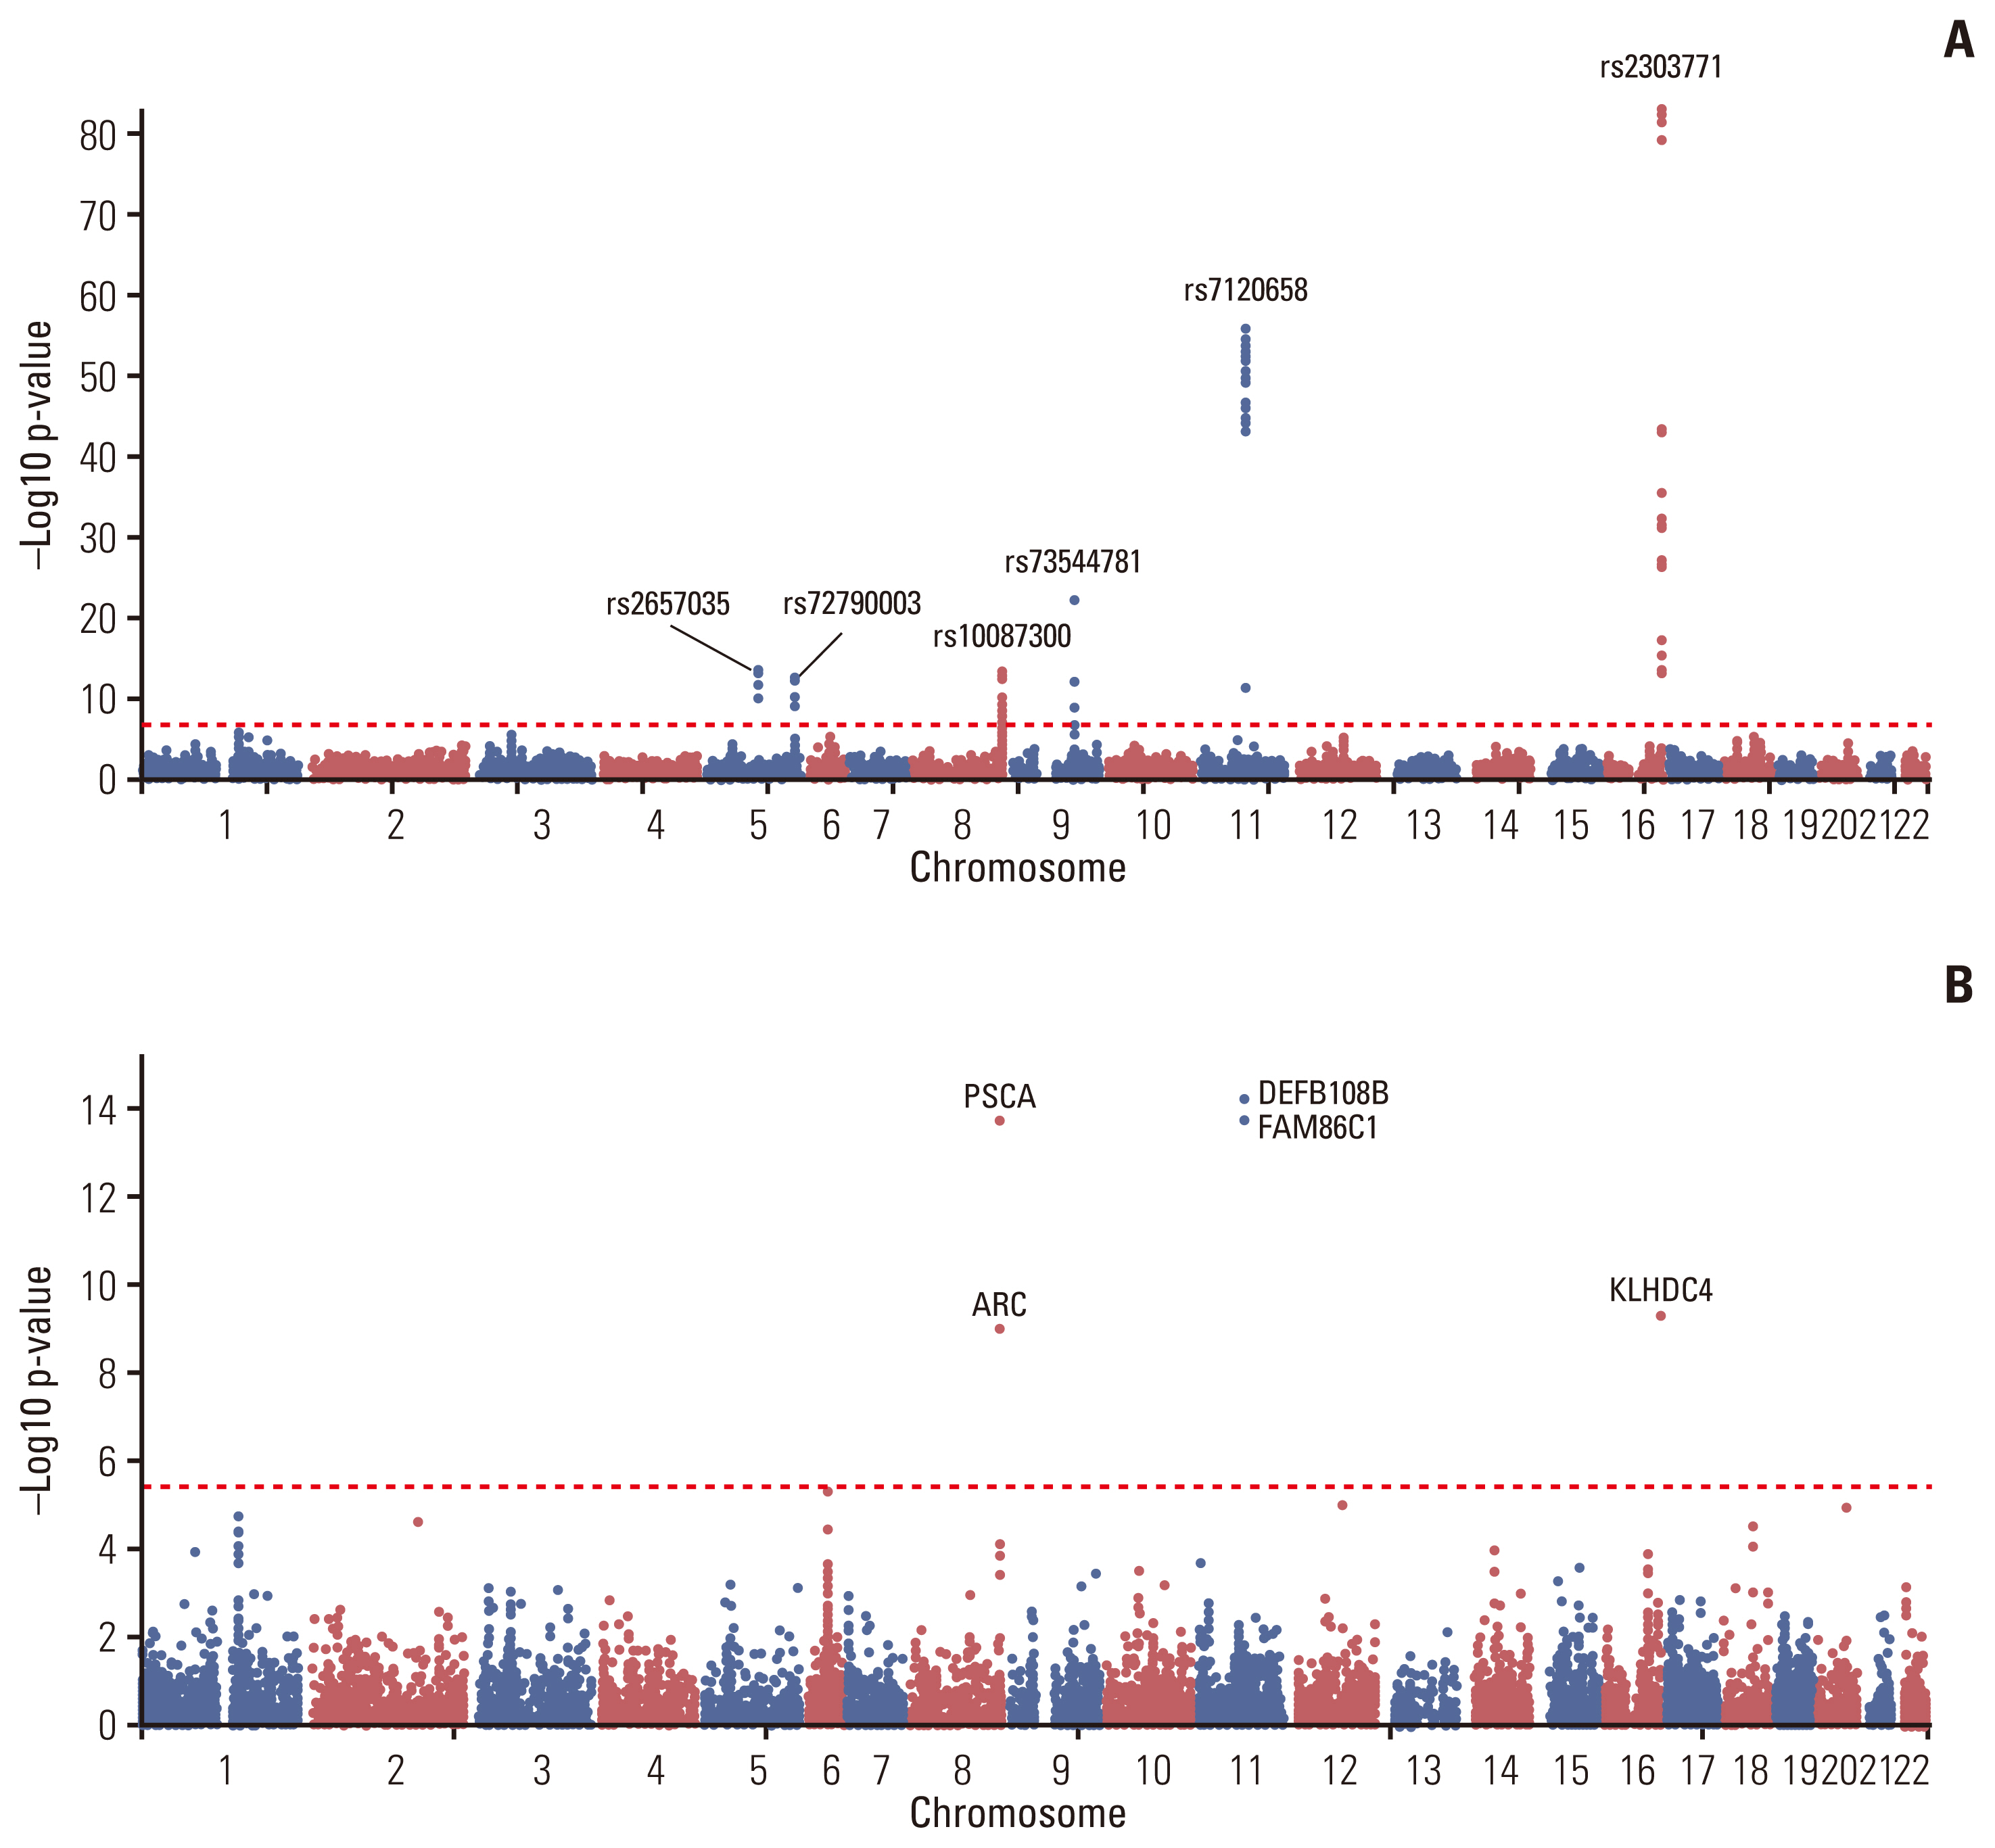
Manhattan plot. The Manhattan plot of gastric cancer genome-wide association study (GWAS) result is shown. (A) Single nucleotide polymorphism (SNP)–based GWAS result. rs2303771 in chromosome 16 had the most significant signal. SNPs with most significant p-value in genomic loci were annotated with their rsID. (B) Gene-based GWAS result. 11,314 mapped coding genes based on all SNPs in the data were used for GWAS.
Among 37 independent significant SNPs across 6 genomic loci, 13 lead SNPs with total 1,002 candidate SNPs were identified. Six genomic loci are described in S3 Table. The majority of candidate SNPs were located in intergenic and intronic region (S4 Fig.), indicating the need for identifying their regulatory consequences on genes in each genomic risk loci. Through gene mapping and prioritizing by its positional and functional consequences, 71 genes were prioritized pinpointing their genetic etiology of GC. In total, 29 genes were discovered by positional mapping of deleterious SNPs across five genomic loci, and 54 genes across 6 genomic loci were mapped by eQTL mapping, and two genes from one genomic locus were mapped by chromatin interaction mapping. Among prioritized genes, 12 genes in chromosome 8, 11, and 16 were mapped by both positional and eQTL mapping, and only KLHDC4 gene was mapped by all mapping methods (Table 1, Fig. 1). In S5 Fig., circos plot of chromosome 16 is depicted. This pinpoints a potentially deleterious role of KLHDC4 gene in GC.
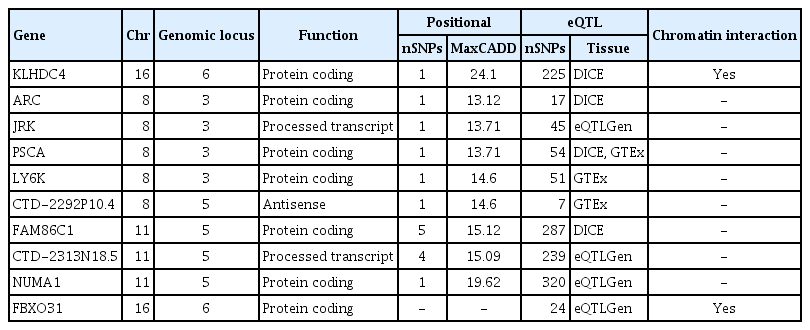
Prioritized genes by three mapping approaches
2. Gene enrichment analysis
Through MAGMA tool, gene-based GWAS test was computed by mapping all SNPs to 13,114 protein-coding genes and the default SNP-wide mean model was with EAS 1000G reference panel. As shown in Fig. 2B, seven genes were under significant p < 3.804×10⁻⁶ (0.05/13,114); DEFB108B had the lowest p=5.94×10⁻¹⁵, followed by FAM86C1 (p=1.74×10⁻¹⁴), PSCA (p=1.81×10⁻¹⁴), and KLHDC4 (p=5.00×10⁻¹⁰) (S6 Table).
MAGMA gene-set analyses were performed using the full distribution of SNP p-values, and is different from pathway enrichment test that only tests for enrichment of prioritized genes. MAGMA gene-set analyses performed for curated gene sets and GO terms obtained from MsigDB. The most significant gene set was related to aminoacyl tRNA synthetase multienzyme complex (p=0.0004). Another top significant gene set was related to otholith development and negative regulation of programmed necrotic cell death. However, after Bonferroni adjustment, those gene sets had p-value over 0.05.
Pathway enrichment test was conducted with 71 prioritized genes. A total 29 gene sets with adjusted p < 0.05 were identified against 57,241 background genes (S7 Table). Gene sets related to copy number variants in breast tumor samples in chromosome 8 and 16 showed significance (adjusted p-value, 3.82×10⁻¹² and 4.31×10⁻⁹, respectively). Furthermore, among prioritized genes, a gene set with FOLR2, PSCA, LY6K, LYPD2, and LY6E showed strong enrichment related to cellular component of membrane; a post-translation modification by synthesis of glycosylphosphatidylinositol (GPI)-anchored proteins pathway (adjusted p=4.44×10⁻⁴), and anchored component of membrane (adjusted p=6.77×10⁻⁹). A gene set consisting PCDHB15, PCDHGA1, PCDHGA2, PCDAGA3, and PCDHGB1 were enriched in a biological pathway of homophilic cell adhesion via plasma membrane adhesion molecules, which is attachment of a plasma membrane adhesion molecule in one cell to an identical molecule in an adjacent cell (adjusted p=3.91×10⁻²). Also, gene sets with molecular functions related to receptor binding showed significant results; acetylcholine receptor inhibitor activity and neurotransmitter receptor regulator activity were enriched with LYNX1 and LY6E genes (adjusted p=2.58×10⁻² and 4.87×10⁻², respectively), and for acetylcholine receptor binding, PSCA showed signals as well. Moreover, folic acid binding pathway with FOLR3 and FOLR2 genes showed enrichment (adjusted p=1.48×10⁻²).
Discussion
In this study, genome-wide association test of GC in Korean population was performed and further functional annotation and gene-based analysis were implemented to concrete the biological interpretation of genetic susceptibility in GC. In GWAS analysis, SNPs significantly associated with GC risk are namely rs2303771, rs7120658, rs73544781, rs72790003, and rs10087300. In post-GWAS gene mapping process using positional, eQTL and chromatin interaction mapping, 71 genes were prioritized. Among prioritized genes, a gene set with FOLR2, PSCA, LY6K, LYPD2, and LY6E showed strong enrichment related to cellular component of membrane; a post-translation modification by synthesis of GPI-anchored proteins pathway.
Several previous GWAS have identified GC associated SNPs and genes in Korean and EAS populations. PSCA gene expression was high in GC patients [27], and candidate SNP approach in a Korean population demonstrated significant associations of PRKAA1 [28], MUC1, and PLCE1 [29]. In addition, another replication study of six SNPs from previous GWASs also identified that only two genes namely PRKAA1 and PSCA showed significant associations in the Korean population [30]. However, no further gene mapping or gene-set analysis was performed in previous studies. Moreover, detailed insight of biological mechanisms related to GC risk was not available.
SNPs were integrated at the level of genes to perform gene-based analysis with a MAGMA tool, and DEFB108B, FAM86C1, PSCA, KLHDC4, ARC, NFKBIL1, and PTPRQ genes showed association with GC risk. PSCA encodes a glycosylphosphatidylinositol-anchored cell membrane glycoprotein at chromosome 8q24, and showed association with GC in previous Asian population studies [27,31,32]. DEFB108B is a protein coding gene related to defensins and immune system pathway. KLHDC4 showed significant signals and mapped by all mapping approaches. KLHDC4 is a protein coding gene and is known to have association with Huntington Disease-Like 2.
Over the past decades, GPI-anchored proteins are known to be involved in cancers by regulating T-lymphocytes proliferation, differentiation, and activation. GPI anchor endows the protein with the ability to associate with lipids [33] where they act as barriers dividing cells into different functional regions. From our study, FOLR2, PSCA, LY6K, LYPD2, and LY6E showed strong enrichment of lipid-related protein of cellular component of membrane; a post-translation modification by synthesis of C-terminal GPI-anchored proteins. LY6E belongs to the human LY6 gene family encoding GPI-anchored protein, and several studies showed relationship with oncogenesis. For example, LY6E showed significantly increased expression in GC [34]. Also in breast cancer, LY6E acts as an activator of hypoxia-inducible factor-1α gene expression leading to the expression of the pro-angiogenic factors such as vascular endothelial cell growth factor (VEGFA) and platelet-derived growth factor B, through decreasing in the expression levels of PTEN (phosphatase and tension homologue deleted in chromosome ten) mRNA and subsequent activation of the phosphatidylinositol 3-kinase/Akt signaling pathway [35]. PSCA gene was repeatably reported from other GC GWAS results [31,32]. PSCA, another type of GPI-anchored protein has been indicated to play a critical role in tumorigenesis, proliferation and cell cycle progression via the upregulation of c-Myc expression [36]. In our study, PSCA had relatively high expression (> 2.84) in stomach tissue among prioritized genes and tissues, indicating its association in the GC.
Pathway related to homophilic cell adhesion via plasma membrane adhesion molecules showed significant signals. Previous study [37] has showed cell adhesion molecules plays an important role in the tumor microenvironment. Moreover, molecular function related to acetylcholine receptor binding significantly associated with lung and colon cancers [38,39].
This study revealed possible causal genes with their genetic pathway of GC in a Korean population by implementing post-GWAS study that might be most likely to benefit knowledge of pathophysiology. To the best of our knowledge, this is the first study conducted as a post-GWAS related to GC risk using a relatively large sample in a Korean population. Nevertheless, there are some potential limitations to be mentioned. First, the number of subjects in this study was relatively smaller than previous GWAS studies, and thus statistical power was limited. Second, further validation of identified genes with cell or tissue experiments are needed as the genetic function of GC was only inferred by bioinformatic analysis. Some genes may show false-positive correlations with GC if they are located in a LD block with true causal genes. Taken together, the gene sets presented in this study require further functional analyses.
In conclusion, through gene-set enrichment analysis, genes involved in signaling pathways related to purine metabolism and GPI-anchored protein in cell membrane are pinpointed to be playing important role in GC. Further post-GWAS could be implemented in large-scale using different ethnicities to benefit the knowledge of pathophysiology in GC.
Electronic Supplementary Material
Supplementary materials are available at Cancer Research and Treatment website (https://www.e-crt.org).
Notes
Ethical Statement
All participants provided written informed consent. The study protocol was approved by Institutional Review Board of the NCC (IRB No. NCC2021-0181).
Author Contributions
Conceived and designed the analysis: Pyun H, Choi IJ, Kim YI, Sung J, Kim J.
Collected the data: Lee J, Choi IJ, Kim YI, Kim J.
Contributed data or analysis tools: Pyun H, Sung J, Kim J.
Performed the analysis: Pyun H, Gunathilake M, Lee J.
Wrote the paper: Pyun H.
Reviewed and edited the manuscript: Gunathilake M, Sung J, Kim J.
Obtain the funding: Kim J.
Critically reviewed the manuscript: Choi IJ, Kim YI.
Conflicts of Interest
Conflict of interest relevant to this article was not reported.
Acknowledgments
This work was supported by grant from National Research Foundation of Korea (2021R1A2C2008439).