Prediction of Pathologic Response to Neoadjuvant Chemoradiotherapy in Patients with Esophageal Squamous Cell Carcinoma Incorporating Hematological Biomarkers
Article information
Abstract
Purpose
This study aimed to develop a nomogram for predicting pathologic complete response (pCR) after neoadjuvant chemoradiotherapy (CRT) in patients with esophageal squamous cell carcinoma (ESCC) by integrating hematological biomarkers and clinicopathological characteristics.
Materials and Methods
Between 2003 and 2017, 306 ESCC patients who underwent neoadjuvant CRT followed by esophagectomy were analyzed. Besides clinicopathological factors, hematological parameters before, during, and after CRT were collected. Univariate and multivariate logistic regression analyses were performed to identify predictive factors for pCR. A nomogram model was built and internally validated.
Results
Absolute lymphocyte count (ALC), lymphocyte to monocyte ratio, albumin, hemoglobin, white blood cell, neutrophil, and platelet count generally declined, whereas neutrophil to lymphocyte ratio (NLR) and platelet to lymphocyte ratio (PLR) increased significantly following neoadjuvant CRT. After surgery, 124 patients (40.5%) achieved a pCR. The pCR group demonstrated significantly more favorable survival than the non-pCR group. On multivariate analysis, significant factors associated with pCR included sex, chemotherapy regimen, post-CRT endoscopic finding, pre-CRT NLR, ALC nadir during CRT, and post-CRT PLR, which were incorporated into the prediction model. The nomogram indicated good accuracy in predicting pCR, with a C-index of 0.75 (95% confidence interval, 0.71 to 0.78).
Conclusion
Female, chemotherapy regimen of cisplatin/vinorelbine, negative post-CRT endoscopic finding, pre-CRT NLR (≤ 2.1), ALC nadir during CRT (> 0.35×10⁹/L), and post-CRT PLR (≤ 83.0) were significantly associated with pCR in ESCC patients treated with neoadjuvant CRT. A nomogram incorporating hematological biomarkers to predict pCR was developed and internally validated, showing good predictive performance.
Introduction
Neoadjuvant chemoradiotherapy (CRT) followed by esophagectomy is the current standard of care for resectable locally advanced esophageal cancer (EC) to achieve more favorable long-term survival than surgery alone [1–4]. Approximately one-third of patients have a pathologic complete response (pCR) after neoadjuvant CRT, which was correlated with significantly improved treatment outcomes [2–6]. Considering the substantial postoperative morbidity and mortality associated with esophagectomy, as well as the impaired quality of life, an organ-preserving approach with active surveillance could be feasible in patients without residual tumor after neoadjuvant treatment [7]. In view of the higher radiosensitivity of esophageal squamous cell carcinoma (ESCC) compared with adenocarcinoma, an accurate prediction of pCR prior to surgery is particularly relevant for Asian patients [2,8]. However, at present no available clinical tools have been developed to confidently predict pCR in EC.
Host immune and inflammatory responses play an important role in cancer development and progression [9]. As a marker of immune suppression, treatment-related lymphopenia has been demonstrated to be a strong prognostic factor for unfavorable outcomes in EC [10–12]. Moreover, several studies have suggested that severe lymphopenia during neoadjuvant CRT is associated with poor pathologic response and recurrence in either esophageal adenocarcinoma or ESCC [13,14]. In addition to lymphopenia, it has been demonstrated that several hematological biomarkers of systemic immuno-inflammation, such as neutrophil to lymphocyte ratio (NLR), platelet to lymphocyte ratio (PLR), and lymphocyte to monocyte ratio (LMR) are linked with patient outcomes in a variety of malignancies [15–17]. Elevated pretreatment NLR and PLR has been reported to be related with worse prognosis in EC patients who underwent surgical resection with or without neoadjuvant treatment [17]. Also, significant relationships between baseline LMR and survival were observed [18]. However, the changes and clinical significance of these biomarkers after neoadjuvant CRT remain uncertain in EC. More importantly, little is known regarding the associations between these immuno-inflammatory parameters and the pathologic response to neoadjuvant CRT.
Given the promise of hematological immuno-inflammation biomarkers in predicting survival, it is possible that these parameters could be used along with other clinical variables to predict pCR in EC. Therefore, we conducted this study to investigate the predictive value of immuno-inflammatory biomarkers in ESCC patients treated with neoadjuvant CRT followed by surgery. Moreover, we aimed to develop a nomogram model for predicting pCR by integrating hematological biomarkers and important clinicopathological characteristics.
Materials and Methods
1. Patients
Consecutive ESCC patients who received neoadjuvant CRT followed by esophagectomy from the prospectively maintained database at our institution from 2003 through 2017 were retrospectively analyzed. The inclusion criteria included: (1) pathologically confirmed stage II–IVa ESCC according to the 8th TNM staging system of the American Joint Committee on Cancer; (2) completed radiotherapy without delay; and (3) documentation of laboratory screens before and during CRT, as well as prior to surgery. Patients with prior or concomitant malignancy, those experienced severe infection before or during CRT, and those with incomplete records were excluded.
2. Treatment and follow-up
Patients received neoadjuvant CRT to a prescription dose of 40.0–50.0 Gy by either three-dimensional conformal radiotherapy or intensity-modulated radiotherapy. All patients underwent concurrent platinum-based chemotherapy during radiotherapy, including cisplatin/vinorelbine (NP), cisplatin/taxane (TP), and cisplatin/fluorouracil (PF). No patients received induction chemotherapy prior to radiotherapy or adjuvant chemotherapy after surgery.
To assess the response to neoadjuvant treatment, all patients underwent preoperative restaging 4 to 6 weeks after the completion of CRT. Restaging evaluation included physical examination, standard laboratory tests, chest/abdominal computed tomography, and esophagogastroduodenoscopy (EGD) with endoscopic ultrasound and optional biopsies when feasible. Positron emission tomography (PET) was performed in selected patients. Esophagectomy was performed using the Ivor Lewis or three-field technique. Surgical specimens were reviewed and a pCR was defined as no residual cancer cells in all layers of the esophagus and in the lymph nodes resected. After surgery, patients were followed up every 3 months during the first 2 years, every 6 months for the next 3 years, and then annually.
3. Data collection
Complete blood counts and blood chemistry findings were collected prior to CRT, each week during CRT, and before surgery (approximately 4–6 weeks after CRT). The minimum absolute lymphocyte count (ALC) during CRT was identified as the nadir. NLR was defined as the neutrophil count divided by ALC, and PLR was defined as the platelet count divided by ALC. Similarly, LMR was indicated as ALC divided by the monocyte count. Regarding post-CRT EGD findings, endoscopic biopsies negative for cancer cells were defined as endoscopic negative. For patients without biopsy, the disappearance of tumor in the primary region without stricture, budding, or ulceration was also assessed as endoscopic negative.
4. Statistical analysis
Age, primary tumor length, and radiation dose were grouped by the median value as cut-offs. Continuous variables were compared by the Wilcoxon rank-sum test. The changes in the value of hematological parameters before and after CRT were compared using the paired t test. Univariate and multivariate logistic regression models were utilized to identify possible predictors for pCR, and factors with univariate significance of p < 0.2 were entered into multivariate analysis (backward stepwise). Spearman rank correlation analysis was conducted to check multicollinearity among hematological parameters.
Variables with statistical significance in the multivariate analysis were then used to build a nomogram for predicting pCR. The performance of the nomogram was assessed by concordance index (C-index), calibration curve with 300 bootstrap resamples, as well as decision curve analysis (DCA). Calibration curve was employed to compare the predicted with the observed probability of pCR, and DCA was generated to evaluate the clinical usefulness of the nomogram model. Additionally, the optimal cut-offs of the continuous variables in the nomogram were determined by the receiver operating characteristic curves.
Survival times were defined from the date of surgery until event or censor. Kaplan-Meier method was used to estimate overall survival (OS), disease-free survival (DFS), locoregional failure-free survival (LRFFS), and distant metastasis-free survival (DMFS), and log-rank test was used to examine intergroup differences. Statistical analyses were performed using SPSS ver. 22.0 software (IBM Corp., Armonk, NY) and R software ver. 3.4.3 (R Foundation for Statistical Computing, Vienna, Austria). p < 0.05 was considered statistically significant.
Results
1. Patient characteristics
Patient and treatment characteristics of 306 ESCC patients who met the inclusion criteria are summarized in Table 1. Median age of the entire cohort was 58 years (range, 34 to 73 years), and the median primary tumor length was 5 cm (range, 1.2 to 14.0 cm). In total, 18.3% were stage II, and 81.7% were stage III/IVa. Half of the patients (50.3%) received a radiation dose of 40 Gy, and 45.8% received 44 Gy. As for chemotherapy regimen, 160 patients (52.3%) received NP, 110 (35.9%) received TP, and 36 (11.8%) received PF during radiotherapy. Endoscopic biopsies were performed in 182 patients (59.5%) prior to surgery, including 64 positive and 118 negative. Based on the combined results of post-CRT EGD and biopsy, 110 patients (35.9%) were defined as endoscopic positive and 196 (64.1%) as endoscopic negative. All patients underwent esophagectomy after the completion of CRT, with a median interval of 6.7 weeks (range, 4.1 to 13.8 weeks).

Patient characteristics and univariate analysis for variables associated with pathologic complete response
Regarding hematological parameters, the median baseline ALC was 1.9×10⁹/L and only 15 patients (4.9%) had lymphopenia before treatment. During CRT, the median ALC decreased steeply to 1.0, 0.6, 0.5, 0.4, and 0.5×10⁹/L from weeks 1 to 5, and then it recovered to 1.2×10⁹/L before surgery. LMR, albumin, hemoglobin, white blood cell, neutrophil, and platelet count generally declined, whereas NLR, PLR, and lactate dehydrogenase level increased significantly following neoadjuvant CRT (Fig. 1). Moreover, no alterations in monocyte counts were observed.

Comparison of hematological parameters before and after neoadjuvant chemoradiotherapy. ALC, absolute lymphocyte count; CRT, chemoradiotherapy; LDH, lactate dehydrogenase; LMR, lymphocyte to monocyte ratio; NLR, neutrophil to lymphocyte ratio; PLR, platelet to lymphocyte ratio; WBC, white blood cell.
2. Pathologic response and survival
A total of 124 patients (40.5%) achieved a pCR after histopathological examination. Compared with non-pCR patients, pre-CRT NLR (p=0.007), pre-CRT PLR (p=0.038), and post-CRT platelet count (p=0.008) were remarkably lower in pCR patients (S1 Fig.). Moreover, post-CRT PLR was slightly lower in pCR patients (p=0.068). Of note, ALC nadir during CRT was significantly higher in patients with pCR (0.4 vs. 0.3×10⁹/L, p=0.022). No significant differences in other hematological parameters were found between pCR and non-pCR patients.
After a median follow-up of 30.1 months for the entire cohort, 74 patients (24.2%) had died and 91 (29.7%) experienced recurrences. In terms of survival endpoints, the pCR group demonstrated significantly more favorable OS, DFS, LRFFS, and DMFS than the non-pCR group (p < 0.05 for all) (Fig. 2).
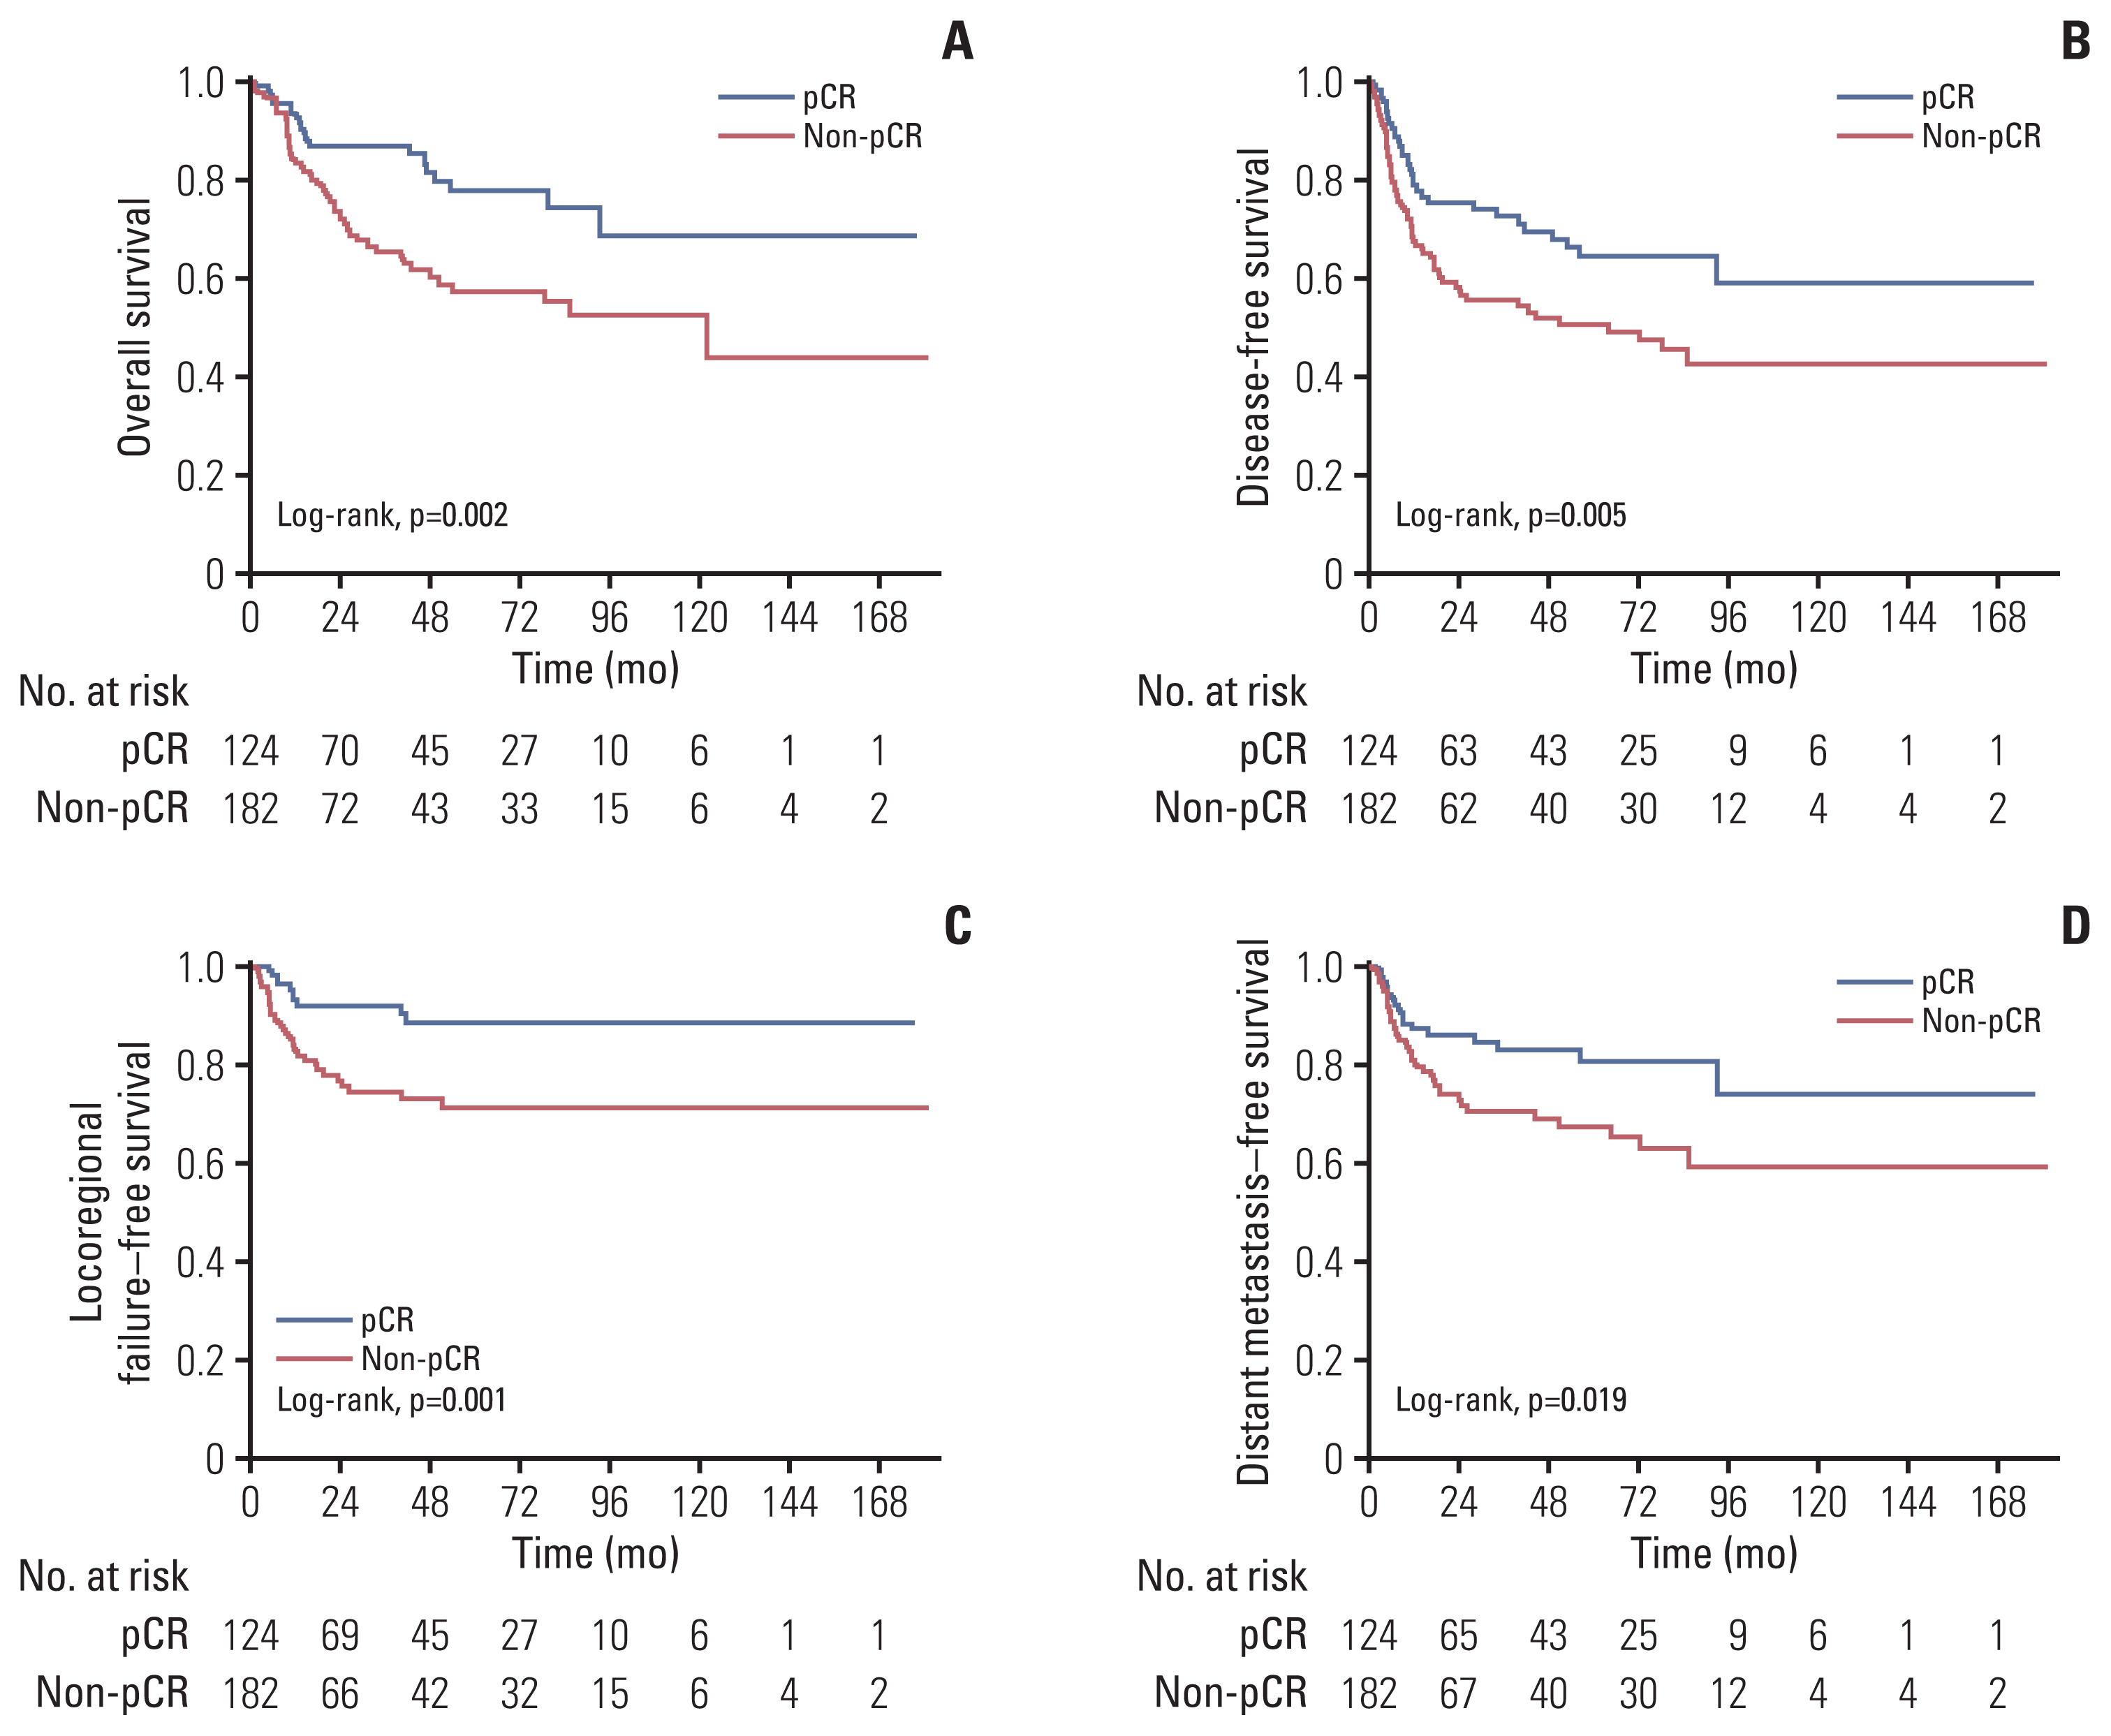
Kaplan-Meier curves for overall survival (A), disease-free survival (B), locoregional failure–free survival (C), and distant metastasis–free survival (D) in patients with and without pathologic complete response (pCR).
3. Factors associated with pCR
We identified clinical characteristics and hematological parameters associated with pCR (Tables 1 and 2). Among clinical characteristics, univariate analysis indicated that sex, cT category, chemotherapy regimen, and post-CRT EGD finding were correlated with pCR. For hematological parameters, pre-CRT NLR, pre-CRT PLR, ALC nadir during CRT, post-CRT platelets, as well as post-CRT PLR were significantly associated with pCR. We further evaluated the impact of hematological parameters on pCR based on logistic regression model. Fig. 3 shows predictive pCR rates as a function of different hematological parameters. Notably, the probabilities of pCR decreased with pre-CRT NLR, pre-CRT PLR, or post-CRT PLR, but it increased significantly with ALC nadir.

Hematological parameters and univariate analysis for variables associated with pathologic complete response
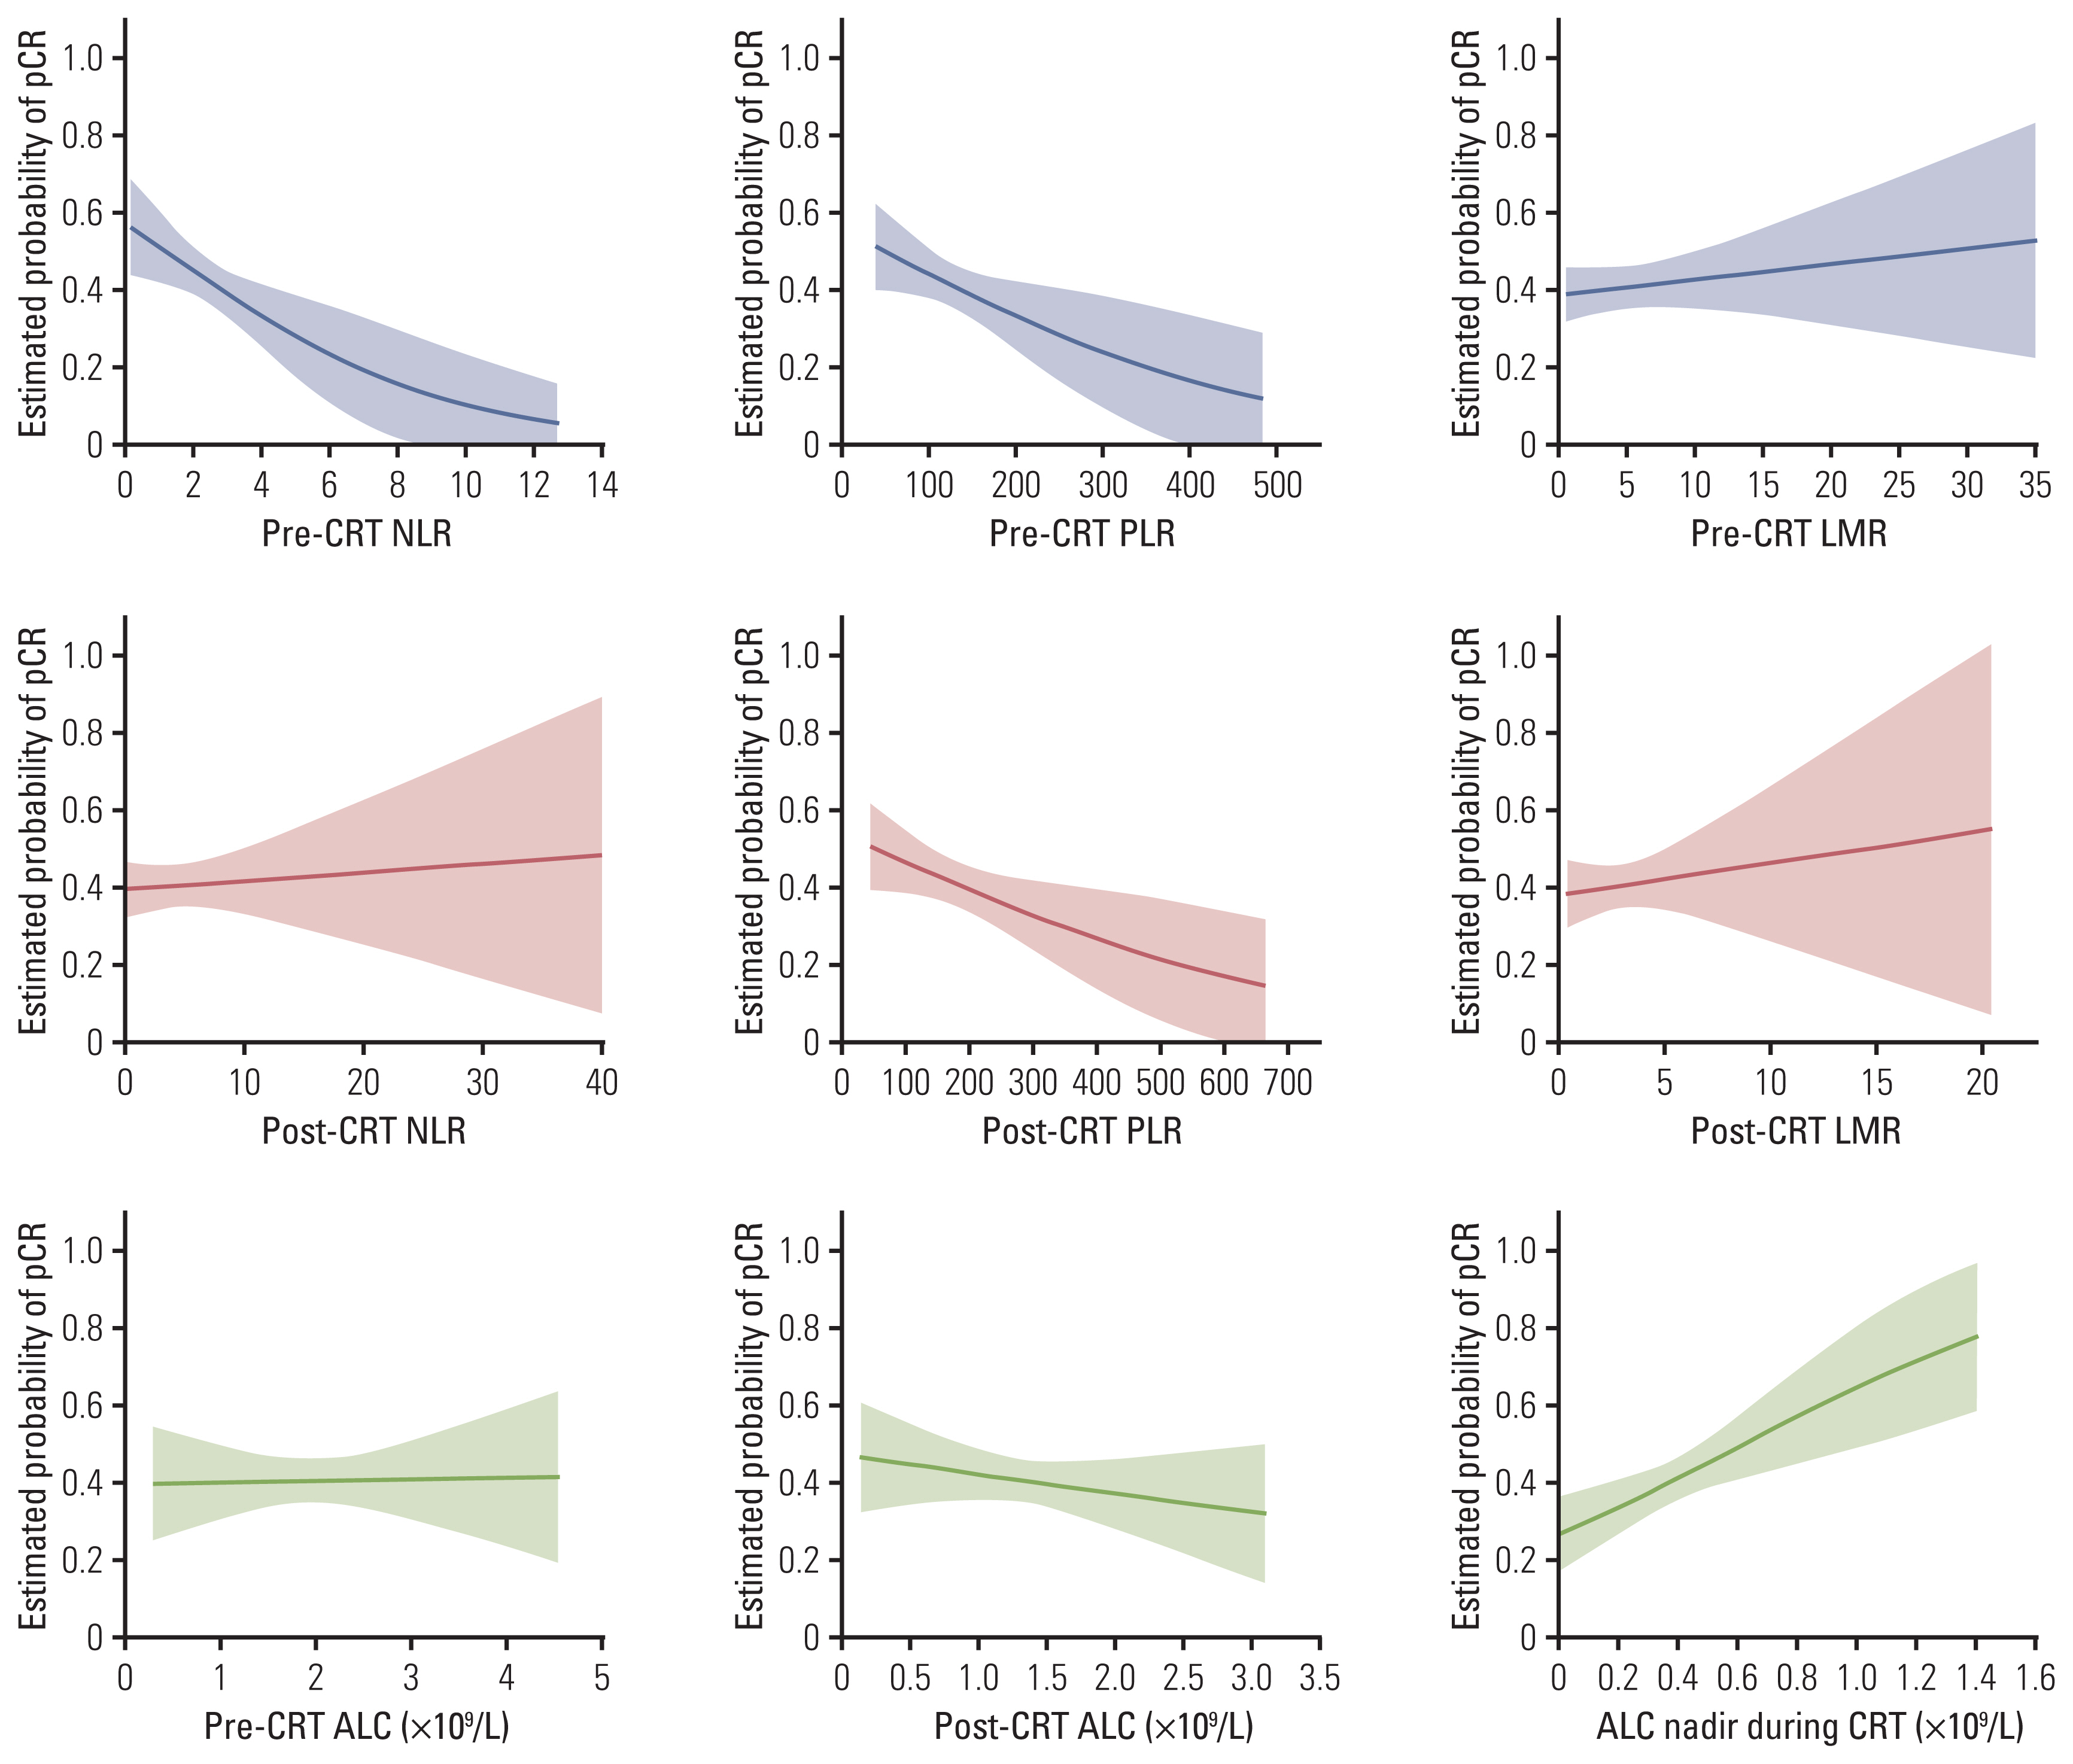
Model to represent the estimated probability of pathologic complete response (pCR) as a function of different hematological parameters based on logistic regression analysis. Shaded regions represent 95% point-wise confidence intervals. ALC, absolute lymphocyte count; CRT, chemoradiotherapy; LMR, lymphocyte to monocyte ratio; NLR, neutrophil to lymphocyte ratio; PLR, platelet to lymphocyte ratio.
For hematological parameters with statistical significance in univariate analysis, Spearman’s correlation analysis indicated weak or moderate correlations between them (S2 Table). Multivariate analysis further demonstrated that sex, chemotherapy regimen, post-CRT EGD finding, pre-CRT NLR, ALC nadir during CRT, and post-CRT PLR were independent predictors of pCR (Table 3).

Multivariate analysis for variables associated with pathologic complete response
4. Nomogram development
A nomogram was developed to predict pCR on the basis of multivariate logistic regression coefficients (Fig. 4). The C-index of the nomogram was 0.75 (95% confidence interval, 0.71 to 0.78), and the calibration curve displayed acceptable agreement between prediction and actual observation (S3 Fig.). In addition, the DCA revealed favorable positive net benefits of the model among the majority of threshold probabilities, implying satisfactory clinical utility.
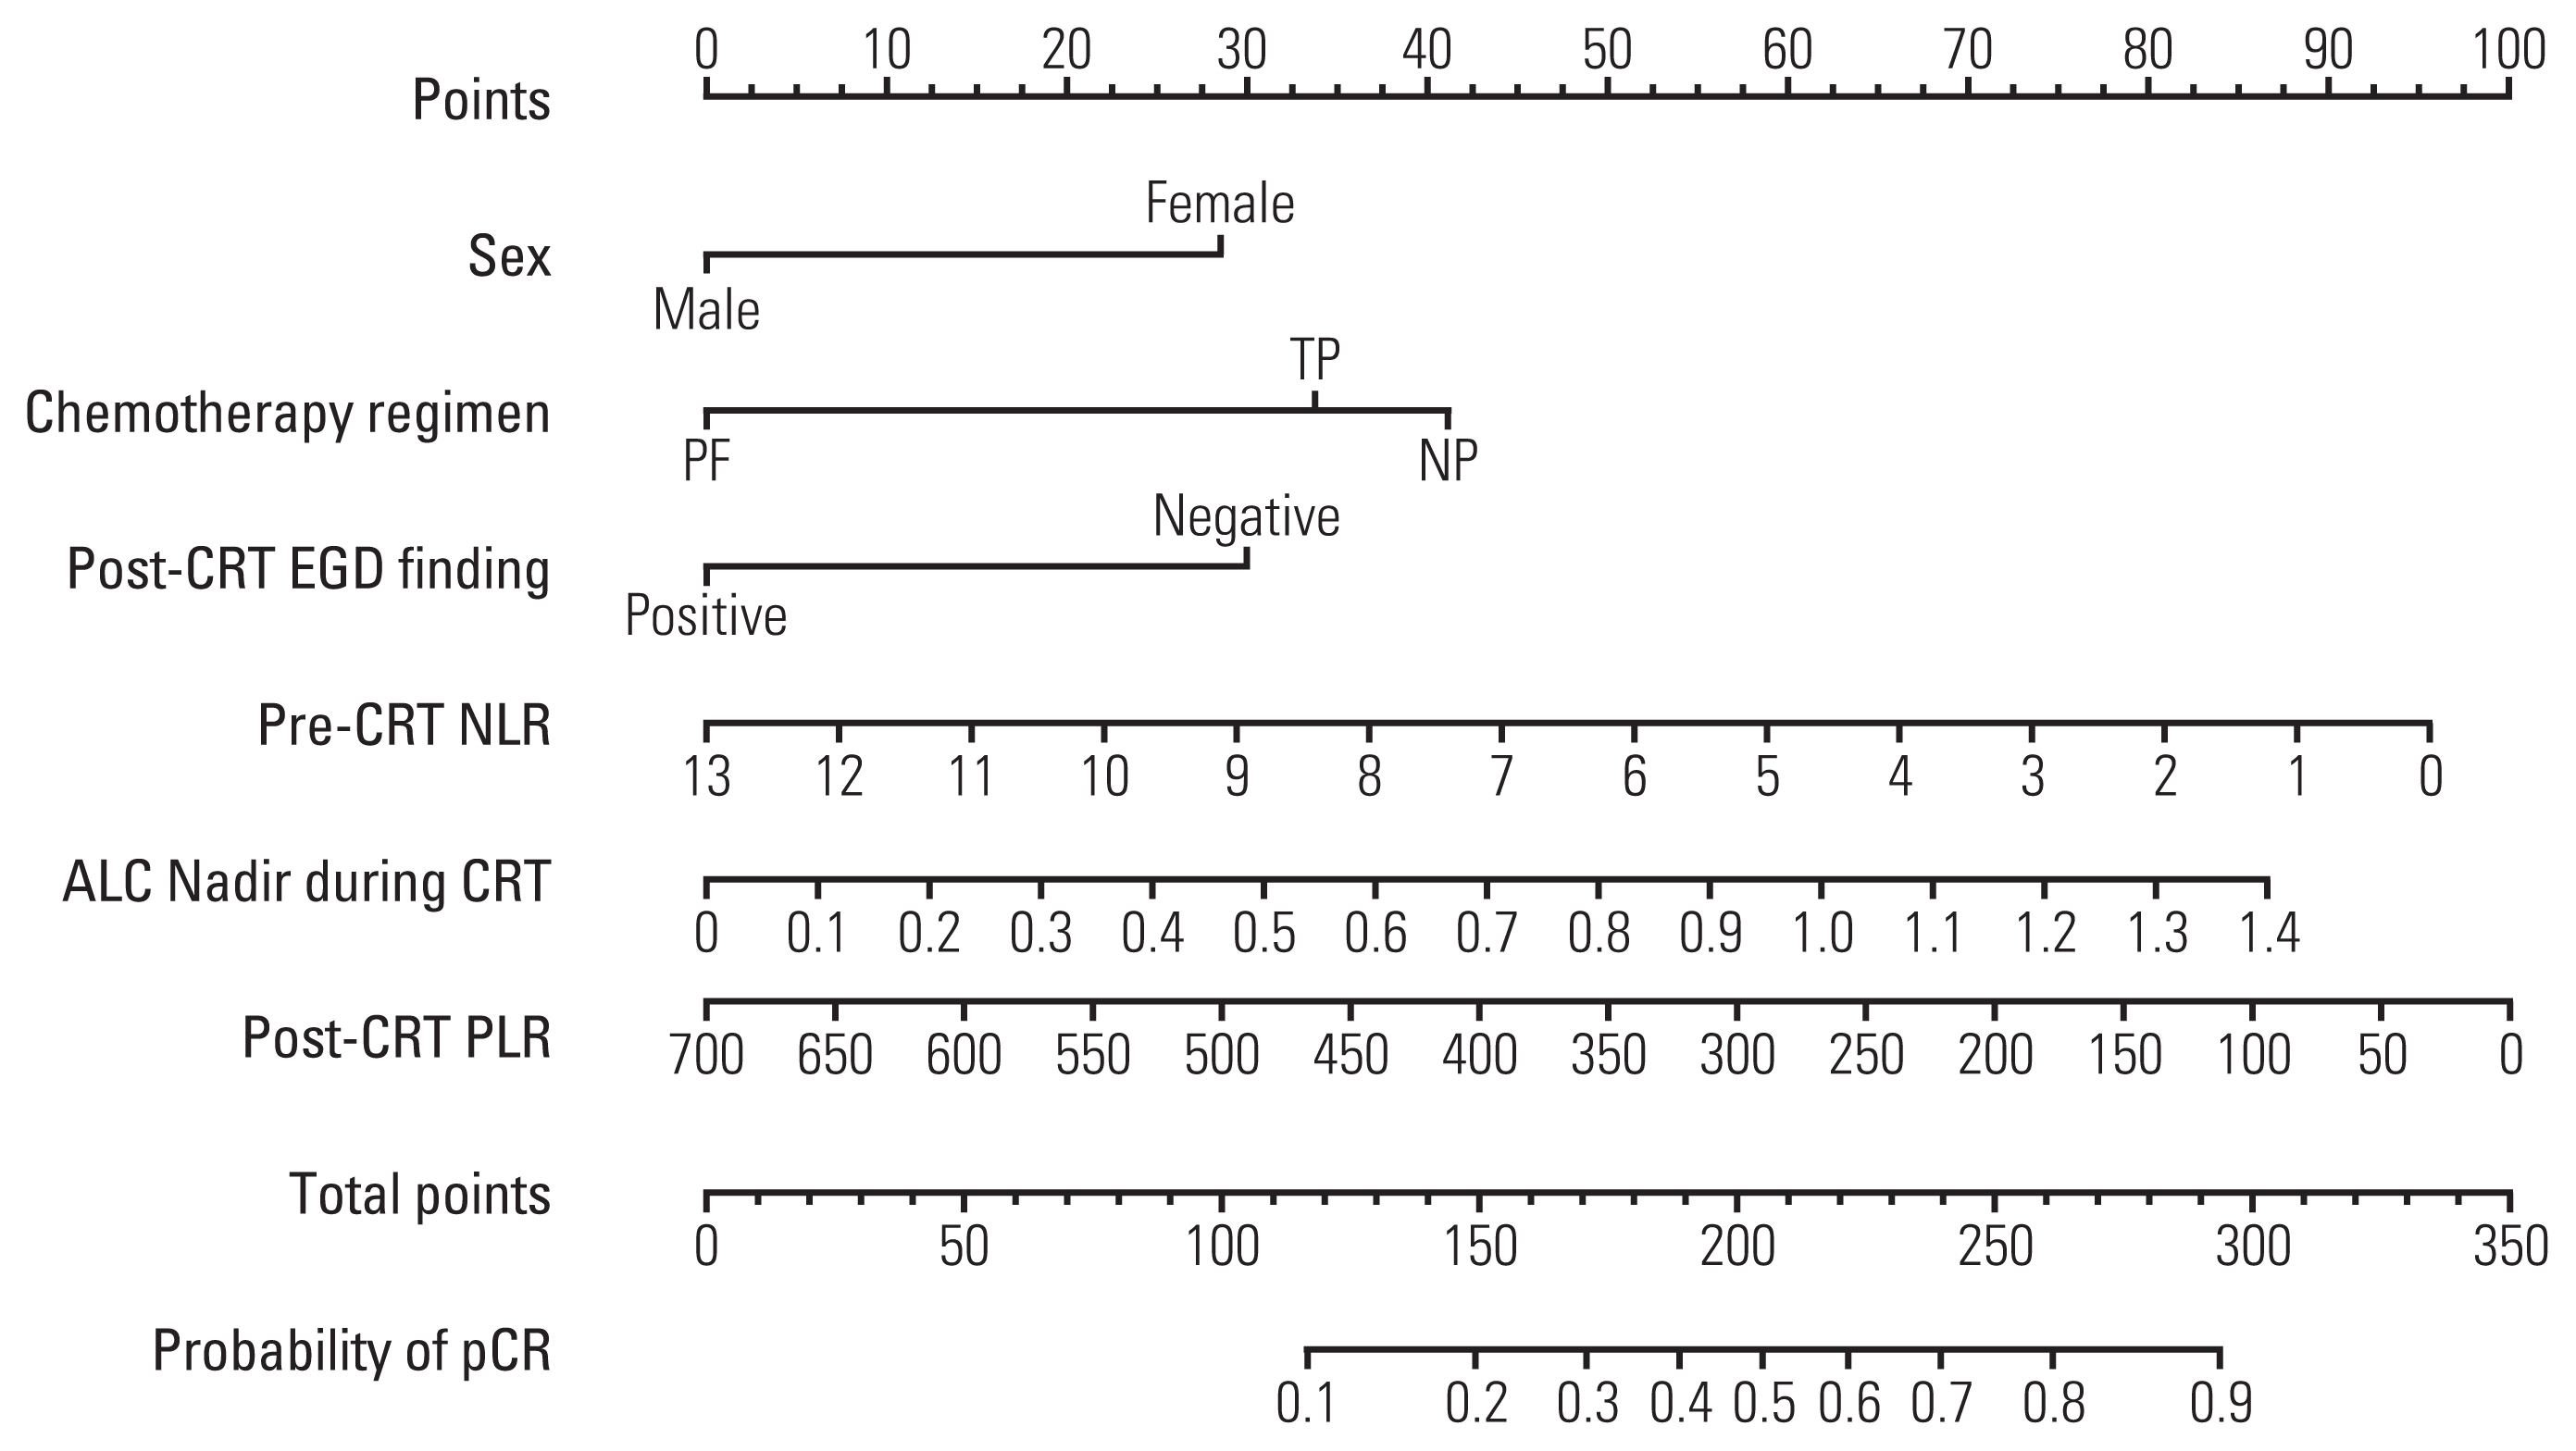
Nomogram for predicting pathologic complete response (pCR) after neoadjuvant chemoradiotherapy (CRT) in patients with esophageal squamous cell carcinoma. For each patient, six lines are drawn upward to determine the points received from the six variables in the nomogram. The sum of these points is located on the “Total Points” axis, then a line is drawn downward to predict the probability of pCR. ALC, absolute lymphocyte count; EGD, esophagogastroduodenoscopy; NLR, neutrophil to lymphocyte ratio; NP, cisplatin/vinorelbine; PF, cisplatin/fluorouracil; PLR, platelet to lymphocyte ratio; TP, cisplatin/taxane.
According to ROC curves, the optimal cut-offs for pre-CRT NLR, ALC nadir during CRT, and post-CRT PLR were 2.1, 0.35×10⁹/L, and 83.0, respectively. Patients with pre-CRT NLR > 2.1 showed a significantly lower pCR rate than those with lower value (32.1% vs. 50.4%, p=0.001). The pCR rate was also lower in patients with high post-CRT PLR > 83.0 (38.4% vs. 76.5%, p=0.004). Additionally, a high ALC nadir > 0.35×10⁹/L was significantly associated with a higher pCR rate (48.3% vs. 35.8%, p=0.031).
Discussion
Predicting pCR to neoadjuvant CRT before surgery has been a focus of research for EC in recent years. In this study, we demonstrated that pre-CRT NLR, ALC nadir during CRT, and post-CRT PLR were significant predictors for pCR in ESCC patients after neoadjuvant CRT. Furthermore, a nomogram incorporating hematological biomarkers has been constructed and internally validated, indicating good prediction ability. To our knowledge, this study was the first attempt to develop a prediction model for pCR incorporating hematological immuno-inflammation biomarkers in EC. Although needing further validation and complementation, this model has a value for assisting patients and clinicians in clinical decision-making.
Since lymphopenia has a negative effect on cell-mediated immunity to initiate tumor cell death [9], there has been growing evidence supporting the correlation between lymphopenia during CRT and pathologic response in cancer patients. Heo et al. [19] reported that maintaining the ALC nadir > 0.35×10⁹/L during CRT could predict pCR in locally advanced rectal cancer. Similarly, Fang et al. [13] also found that a higher ALC level (≥ 0.35×10⁹/L) during CRT was associated with a higher rate of pCR in patients with esophageal adenocarcinoma undergoing trimodality therapy. In a previous study regarding ESCC, patients with grade 4 lymphopenia had a significantly lower pCR rate than those with grade 0–3 lymphopenia (22.9% vs. 48.8%, p=0.001) [14]. Nevertheless, no general consensus has been reached for the level of ALC nadir that was predictive of pCR. Interestingly, we also found that sustaining a higher ALC level during CRT was notably correlated with pCR in ESCC, and the optimal cut-off of ALC nadir > 0.35×10⁹/L was identical to that suggested by Heo et al. [19] and Fang et al. [13]. Therefore, ALC nadir > 0.35×10⁹/L might be a widely accepted cutoff for cancer patients. Expect from lymphopenia during CRT, neither pre- nor post-CRT ALC was correlated with pCR in our study, which was consistent with the data reported by Deng et al. [20].
Inflammation can stimulate angiogenesis and affect immune surveillance as well as treatment response [9]. Tumorigenesis and proliferation are driven by the production of inflammatory cytokines, which could recruit inflammatory cells, including neutrophils and activated platelets [21]. On the one hand, neutrophils activate transcription factors that influence the production of more inflammatory mediators. On the other hand, platelets serve as a critical source of growth factors, which can promote angiogenesis and invasion. Then these cellular perturbations can result in an inhibition of host adaptive immune system and subsequent downregulation of T-cell response [9,21]. Therefore, NLR and PLR have been proposed to be reliable indicators of host inflammatory status. In literature, there are limited data regarding the predictive value of hematological immuno-inflammation biomarkers for pCR after neoadjuvant treatment in EC [22,23]. In a small study including 60 EC patients reported by McLaren et al. [22] elevated pretreatment NLR and PLR were significant predictors of poor response to neoadjuvant CRT. Nevertheless, another recent study found that baseline NLR was related to OS and DFS but not pCR in 149 EC patients [23]. As indicated above, the predictive value of NLR and PLR is controversial. Moreover, whether post-CRT NLR or PLR could be recognized as predictive indicators remains unclear. Based on a large cohort of patients, our results demonstrated that pre-CRT NLR and post-CRT PLR, but not pre-CRT PLR, were independent predictors of pCR in ESCC, suggesting that these hematological biomarkers could be used along with other potential predictors to build a predictive model. Further study is warranted to investigate the underlying mechanisms that link hematological immuno-inflammation biomarkers to pathologic response after CRT in EC.
In addition to hematological biomarkers, the current study also indicated that chemotherapy regimen of NP was significantly correlated with higher pCR rate. Although PF is a commonly used chemotherapy regimen for EC, the response rate is unsatisfactory after neoadjuvant CRT, with pCR rates of 20% to 40% [1,5,6]. Vinorelbine is an effective agent in ESCC with an acceptable tolerance profile [24]. In our previous matched case-control study of 114 patients with ESCC, the NP group showed a higher pCR rate (47.4% vs. 28.1%, p=0.034), more favorable survival, and comparable incidence of postoperative complications compared with PF group [25]. In addition, the multicenter phase III trial NEOCRTEC5010 reported that the pCR rate with NP regimen was 43.2% in the neoadjuvant CRT group, which confirmed the benefit of this regimen in ESCC [4].
Several models have been developed by integrating various clinicopathological variables to predict pCR after neoadjuvant CRT in EC [26–28]. As shown in S4 Table, two models reported by Ajani et al. [26] and Toxopeus et al. [27] were mainly focused on esophageal adenocarcinoma. Chao et al. [28] built a nomogram incorporating five variables that showed excellent accuracy for predicting pCR in ESCC, with a C-index of 0.83. However, it should be noted that only 25.8% of patients achieved a pCR in this study, which was much lower than the majority of published data regarding ESCC. A possible explanation could be that the prescription dose for 91.6% of patients was 30 Gy in 15 fractions, which was significantly lower than the recommended dose by guidelines. Moreover, the concurrent chemotherapy regimen of PF might also contribute to the lower pCR rate in their study.
Our study has several limitations. First, selection bias could not be completely avoided owing to the retrospective nature of this work. Accordingly, multicenter prospective studies are needed to confirm the results. Second, despite good accuracy for predicting pCR of the present nomogram model, the findings would be more convincing if it had been validated in an independent cohort. Third, although patients who experienced severe infection before or during CRT were excluded from the database, we could not account for all factors that might affect blood counts such as non-chemotherapy medications. Fourth, since PET scans were not available for all patients, this model did not include any features related to functional imaging. Lastly, the clinical response to neoadjuvant CRT was evaluated by EGD with regular biopsies. The use of bite-on-bite biopsies may further improve diagnostic accuracy in the future [29].
Of note, despite cost-effective and non-invasive, the discriminatory ability of this nomogram is still not sufficient to fully guide clinical decision-making. Thus, integrating other novel predictive factors into the model may further improve its prediction ability. Changes in 18F-fluorodeoxyglucose PET parameters after neoadjuvant CRT, as well as changes of parameters in diffusion-weighted magnetic resonance imaging have been demonstrated to be of complementary value in the evaluation of pathological response [30]. The alternations in PET radiomic features during CRT also have shown promising results for prediction of response in EC [31]. As reported by Azad et al. [32] the detection of circulating tumor DNA before and after CRT could be an encouraging addition to the assessment of treatment response and tumor progression in EC patients. Additionally, there is increasing evidence on the value of immune marker expression in predicting response to CRT, such as CD8+ tumor-infiltrating lymphocyte, programmed cell death-ligand 1, and indoleamine 2,3-dioxygenase 1 [33]. The relevant work regarding incorporating additional valuable biomarkers into the current model is now underway at our institution.
Female, chemotherapy regimen of NP, negative post-CRT EGD finding, pre-CRT NLR (≤ 2.1), ALC nadir during CRT (> 0.35×10⁹/L), and post-CRT PLR (≤ 83.0) were significantly associated with pCR in ESCC patients treated with neoadjuvant CRT. A nomogram incorporating hematological biomarkers to predict pCR was developed and internally validated, showing good predictive performance. Additional large-scale prospective studies are needed to validate this model and to extend our findings.
Electronic Supplementary Material
Supplementary materials are available at Cancer Research and Treatment website (https://www.e-crt.org).
Notes
Ethical Statement
This analysis was approved by the Institutional Review Boards of our institution and informed consent was waived due to its retrospective nature.
Author Contributions
Conceived and designed the analysis: Guo S, Xi M.
Collected the data: Wu Y, Chen J, Zhao L, Li Q.
Contributed data or analysis tools: Wu Y, Zhao L, Li Q, Yang H, Guo S, Xi M.
Performed the analysis: Wu Y, Chen J, Zhao L, Zhu J, Xi M.
Wrote the paper: Wu Y, Chen J, Zhao L, Li Q, Zhu J, Yang H, Guo S, Xi M.
Conflicts of Interest
Conflicts of interest relevant to this article was not reported.
Acknowledgements
This work was supported by grants from the Fundamental Research Funds for the Central Universities (19ykpy176), Medical Scientific Research Foundation of Guangdong Province (C2015030), and Natural Science Foundation of Guangdong Province (2019A-1515011420).