High-Throughput Multiplex Immunohistochemical Imaging of the Tumor and Its Microenvironment
Article information
Abstract
Purpose
The aim of this study was to develop a formalin-fixed paraffin-embedded (FFPE) tissue based multiplex immunochemistry (mIHC) method for high-throughput comprehensive tissue imaging and demonstrate its feasibility, validity, and usefulness.
Materials and Methods
The mIHC protocol was developed and tested on tissue microarray slides made from archived gastric cancer (GC) tissue samples. On a single FFPE slide, cyclic immunochemistry for multiple markers of immune cells and cytokeratin for tumor cells was performed; hematoxylin staining was used for demarcation of nuclei. Whole slides were digitally scanned after each cycle. For interpretation of mIHC results, we performed computer-assisted image analysis using publicly available software.
Results
Using mIHC, we were able to characterize the tumor microenvironment (TME) of GCs with accurate visualization of various immune cells harboring complex immunophenotypes. Spatial information regarding intratumoral and peritumoral TME could be demonstrated by digital segmentation of image guided by cytokeratin staining results. We further extended the application of mIHC by showing that subcellular localization of molecules can be achieved by image analysis of mIHC results.
Conclusion
We developed a robust method for high-throughput multiplex imaging of FFPE tissue slides. The feasibility and adaptability of mIHC suggest that it is an efficient method for in situ single-cell characterization and analysis.
Introduction
During the last decade, the tumor microenvironment (TME) has emerged as one of the most important next-generation hallmarks of cancer [1]. In addition, the introduction of immunotherapy in treating various types of cancer [2-4] has increased the need for a proper way of assessing TME for both clinical and research purposes.
Conventional tissue imaging using hematoxylin and eosin staining and single immunostaining using formalin-fixed paraffin-embedded (FFPE) tissue samples have been the key for the diagnosis of cancer as well as for the fundamental working platform used to elucidate tumor biology. For example, an immunoscore system based on immunohistochemistry (IHC) using immune cell markers, including CD3 and CD8, was proposed and validated as a novel way of predicting the prognosis of colorectal cancer [5].
However, most recent immuno-oncology research projects focus on identifying the role of specific immune cell subsets within their spatial context. Increasing demand for deeper information on TME has led to the development of novel technologies, such as multiplexed imaging [6], CyTOF mass cytometry [7], and single-cell RNA sequencing [8]. While CyTOF and single sequencing are robust ways for dissecting TME, deciphering the spatial context between TME and tumor cells is not always feasible and the underlying high-fidelity techniques hinder these novel technologies from being incorporated into clinical practice. Multiplex immunohistochemistry (mIHC) has advantages over mass cytometry and single-cell transcriptomic analysis, in that it is much easier to implement because it requires no additional devices. In addition, bright-field imaging using mIHC enables the visualization of the tumor and TME at a much better resolution using FFPE samples, which are the most widely used specimens for the histopathological diagnosis of cancer.
Here, we introduce an in-house developed mIHC method enabling high-throughput comprehensive tissue imaging using devices commonly used in pathology labs. This mIHC method is also customizable to meet the needs for research and clinical assessment. The purpose of this study was to demonstrate and validate mIHC for the imaging of TME subsets and to explore the potential targets of mIHC imaging and extend its range of usage.
Materials and Methods
1. Patients and specimens
Fifty-eight FFPE tissue samples of surgically resected gastric cancer (GC) were retrieved from the archives of Department of Pathology, Seoul National University Bundang Hospital (SNUBH). The collected tissue samples were remaining samples after proper histologic diagnosis and relevant molecular study. Representative tissue areas were reviewed and selected for the construction of tissue microarray (TMA) as described previously [9].
2. Reagents and resources
All reagents used in this study are listed in Table 1. In addition, staining devices and software for image analyses are also listed. Sequential IHC antibody panels were designed as described in Table 2.

Key resources table

Sequential IHC antibody panel information
3. Preprocessing of tissue samples for mIHC
For manual preprocessing of tissue samples, 4-μm FFPE slides were incubated in dry oven at 60℃ for 1 hour. Slides were then immersed in xylene for 4 minutes and repeated 5 times for deparaffinization. Rehydration was performed by sequentially immersing slides in 100% ethanol, 95% ethanol, and 75% ethanol for 3 minutes each, repeated twice. Following rehydration, slides were immersed in tap water for 5 minutes.
4. Performing sequential mIHC
The steps beginning with sequential mIHC to post-processing of images are depicted in Fig. 1.

Overview of multiplex immunohistochemistry (IHC) process. After preprocessing, hematoxylin staining for identification of nuclei is the first step, followed by cyclic IHC including steps of antigen retrieval, antibody incubation, whole slide scanning, and antibody stripping. This cyclic IHC can be repeated up to 10 times and the panel of IHC markers can be customized. FFPE, formalinfixed paraffin-embedded.
1) Step 1: Nuclear staining
For clear nuclear staining, preprocessed slides were first incubated with Harris hematoxylin for 5 minutes, washed in tap water for 1 minute, followed by 1% hydrogen chloride (HCl) solution for 3 seconds. After washing slides for 10 minutes in tap water, slides were mounted with aqueous mounting solution and coverslipped. Whole slide scanning and image acquisition were performed using Aperio AT2 (Leica Biosystems, Newcastle upon Tyne, UK).
2) Step 2: Antigen retrieval and blocking
After de-coverslipping, the slides were placed with Tris-EDTA buffer, pH 9.0 and citrate buffer, pH 6.0, which were microwaved at low power for 15 minutes for antigen retrieval. After cooling to room temperature, slides were immersed with peroxidase-blocking solution (Dako, Carpinteria, CA) for 5 minutes for blocking endogenous peroxidase activity and washed in wash buffer (Dako) twice.
3) Step 3: Antibody incubation
Slides from step 2 were subsequently incubated with primary antibodies for 60 minutes at appropriate temperature for each type of antibody. Slides were then washed twice in wash buffer (Dako). Afterwards, incubation with secondary reagent (Envision FLEX+ mouse linker/rabbit linker, Dako) was performed for 20 minutes. For better imaging of certain antibodies, incubation with tertiary reagent (mouse anti-rabbit IgG/rabbit anti-mouse IgG, Invitrogen, Waltham, MA) was added for 30 minutes.
After washing in wash buffer (Dako) twice, slides were incubated with either anti-rabbit or anti-mouse Envision+ System horseradish peroxidase-labeled polymer for 30 minutes. For chromogenic reaction and visualization, peroxidase detection using ImmPact NovaRED (Vector Laboratories, Burlingame, CA) for 2 minutes. Slides were then washed in distilled water (DW) and wash buffer (Dako), twice each. Nuclear counterstaining using Mayer’s hematoxylin was performed, and slides were mounted and coverslipped using aqueous mount, at this point ready for whole slide scanning.
4) Step 4: Antibody stripping
Following image acquisition, slides were immersed in DW for 10 minutes for de-coverslipping. De-coverslipped slides were incubated with pre-mixed stripping buffer (20% sodium dodecyl sulfate, 0.5 M Tris-HCl pH 6.8, β-Mercaptoethanol, and DW) at 56℃ for 40 minutes in shaking chamber, followed by washing in DW for 10 minutes. Slides were microwaved at low power to get more stripping effects and then sent back up to “Step 2: Antigen retrieval” for sequential IHC up to 10 times.
5. Post-processing of scanned images
The first step of image processing includes extraction of each 2-mm TMA core as a unit of analysis, using Aperio ImageScope (Leica Biosystems). Alignment of cropped core images should be the next step; guided by nuclear hematoxylin staining, extracted images are moved along x and y axis to exactly match each other using CellProfiler (ver. 3.1.8. Broad Institute, Cambridge, MA) [10]. The accurate alignment of images enables identification of every single cell as the minimum unit of analysis.
Single cell-based retrieval of information such as staining intensity and distance from the tumor cells can be achieved by running pipelines in CellProfiler. A CSV file (*.csv) containing raw data from a single core is created, where columns show numerous variables related to staining results of all immunostained parameters and rows represent each single cell.
Since the staining results of all parameters are provided in continuous variables, appropriate cut-off values for each marker should be designated from either manual inspection of immunostained images or from analyzing distribution of staining intensity to find the reasonable cut-offs. The quantification of positive or negative cells for each item can be performed by applying designated cut-off values, and their various combinations can create enormous amount of data, representing the comprehensive immune profile of each cell.
6. Characterization of TME and immune cells
After quantifying the amount of tumor-infiltrating immune cells with certain immunophenotype, the numbers/densities of each cell type from different cores can simply be compared. In addition, unsupervised or supervised hierarchical clustering based on the numbers/densities of each cell type can be useful for finding out whether distinct TME subgroups exist within the study population.
For more information regarding spatial context, simply adding cytokeratin (CK) IHC into the sequential mIHC panel can generate an enormous amount of additional information. By assigning nuclear hematoxylin staining of various tumorinfiltrating immune cells into primary objects and CK IHC into secondary objects, the distances between CK-positive tumor cells and certain immune cells can be estimated by CellProfiler pipeline. Therefore, digital distinction between intratumoral and peritumoral immune cells can be achieved.
Furthermore, mIHC metadata are also compatible with various analytic pipelines that were originally developed for the analyses of CyTOF mass cytometry data, including viSNE [11]. Raw csv files or text files (*.txt) created from mIHC analyses can be converted into FCS files (*.fcs) using R package “flowCore,” to be used as input files for flow cytometry analytic pipelines. R package “cytofkit” was utilized for running viSNE on a bulk, ungated mode of analysis.
7. Subcellular localization using mIHC
Besides providing spatial information, the addition of CK IHC during mIHC process also enables subcellular localization of molecules of interest. On finishing the alignment of extracted images, CellProfiler enables assignment of RGBbased pseudocolor on each immunostained item. Assignment of pseudocolors on CK and hematoxylin delineates cell membranes and nuclei respectively, and as a result, cytoplasmic spaces as well. By segmentation of subcellular structure by pseudocolor assignment, the subcellular localization of target molecules can be achieved.
8. Epstein-Barr virus in situ hybridization
Epstein-Barr virus (EBV) in situ hybridization using INFORM EBV-encoded RNA probe (Ventana Medical Systems, Tucson, AZ) was performed to assess the EBV positivity of GC cases. Cases with a diffuse strong nuclear positivity were interpreted as EBV+ GCs.
9. Microsatellite instability testing
The microsatellite instability (MSI) status of GCs was assessed according to Revised Bethesda Guidelines [12]. Polymerase chain reaction (PCR) amplification of the extracted DNA from tumor and normal cells was performed and the PCR products were analyzed using a DNA autosequencer (ABI 3731 Genetic Analyzer, Applied Biosystems, Foster City, CA). Allele profiles of five markers (BAT-26, BAT-25, D5S346, D17S250, and S2S123) in tumor cells were compared to profiles of match normal cells. Tumors with additional alleles in two or more markers were classified as MSI-high, tumors with novel bands in one marker were defined as MSI-low, and those with identical bands in all five markers were classified as microsatellite stable.
10. Ethical statement
The study was approved by the Institutional Review Board (IRB) of SNUBH (IRB No. B-1606/349-308) and Seoul National University Hospital (SNUH) (IRB No. 1706-105-860) and performed in accordance with the principles of the Declaration of Helsinki. The informed consent was waived.
Results
1. High-throughput identification and quantification of TME subsets
For the validation of mIHC for assessment of TME subsets, we performed cyclic immunostaining of the TME panel on a TMA constructed from GC tissue samples. The TME panel (Table 2) consisted of markers for tumor-infiltrating immune cells (CD3, CD4, CD8, FOXP3, and CD68), immune checkpoint molecules (PD-L1, PD1, TIM3, and LAG3), and CK for identification of tumor cells.
Conventional IHC images were extracted as large images and accurately aligned with each other on both x and y axes, guided by hematoxylin staining images (Fig. 2A). After alignment and merging, every cell became an individual unit of analysis; metadata containing the staining intensity of immunostained markers in each cell were then produced. To assign a positive or negative status to each cell for all immunostained markers, appropriate determination of cut-off values of staining intensity was carried out. For example, as shown in Fig. 2B, we used 0.35 as the positivity threshold for CD3 immunostaining. Cut-off values for individual markers are listed in Table 2.
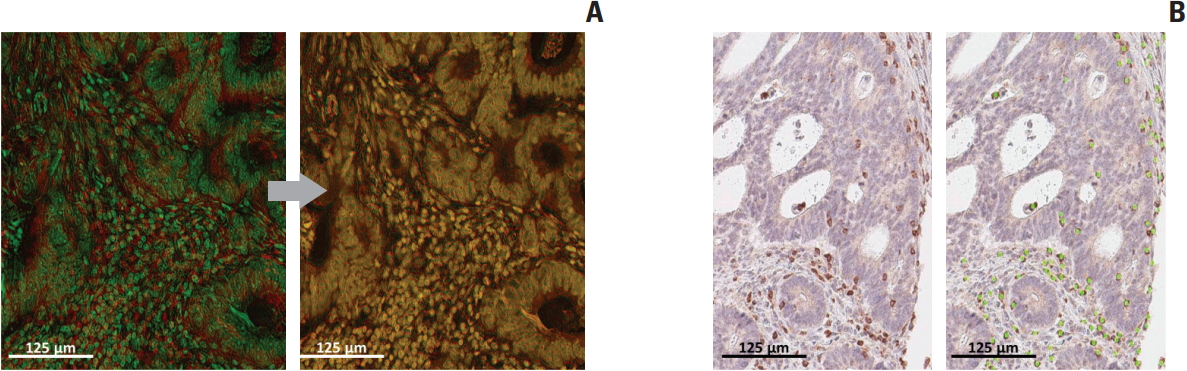
Post-processing of cyclic immunohistochemistry (IHC) images for further analysis. (A) Bright-field images of cyclic IHC on the same slide should be aligned accurately for correct analysis. (B) Determination of cut-off value for each staining can be digitally guided for optimization. Scale bars=125 μm
The most striking and useful feature of mIHC is the intuitive visualization of the TME using pseudocolors assigned to each combination of positive markers. As shown in Fig. 3A, cyclic IHC of a panel of TME markers and CK was performed on the same FFPE slide. After alignment and merging of cyclic images, pseudocolors representing each combination were applied. This allowed us to easily see the presence of intratumoral and peritumoral CD8+ cells (Fig. 3B) with variable expression of immune inhibitory markers, such as PD1, TIM-3, and LAG3 (Fig. 3C).
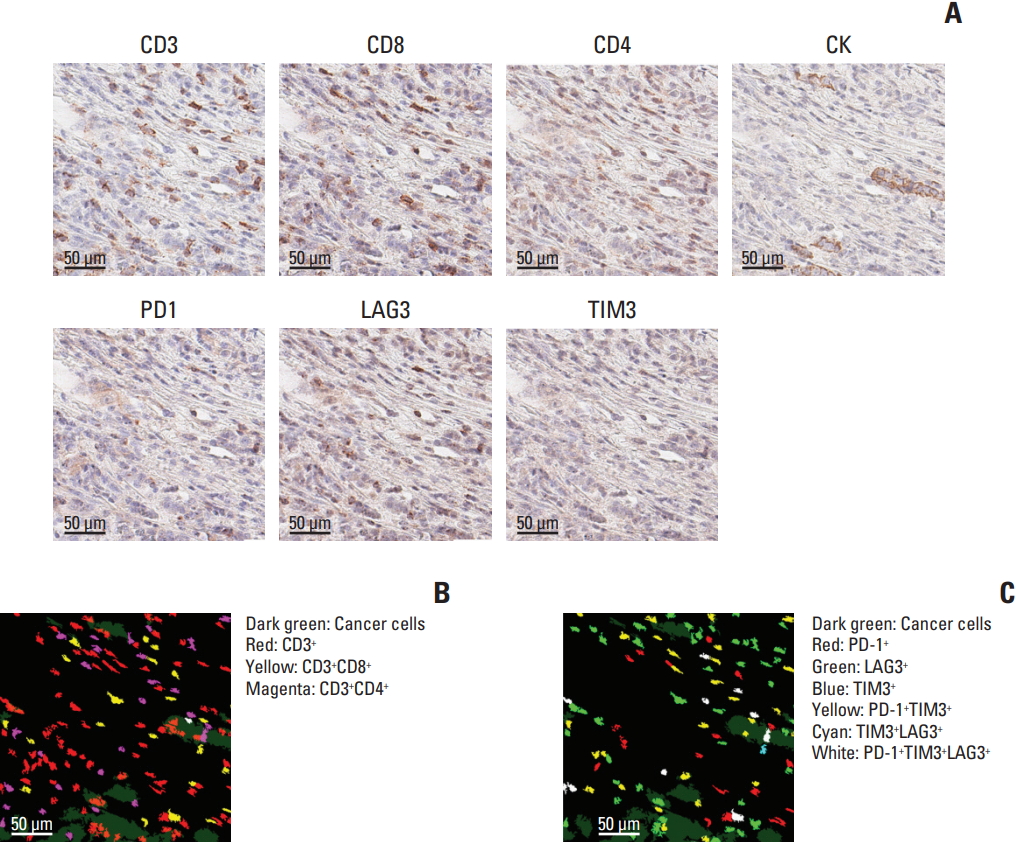
Intuitive visualization and characterization of tumor microenvironment by multiplex immunohistochemistry. (A) Representative images of different markers in the same area are shown. Distribution of T-cell subsets (B) and immune cells expressing inhibitory molecules (C) can be visualized after assigning pseudocolors. The area of the images is 1/64 of a single core. Scale bars=50 μm.
For the quantitative and objective determination of the differences in TME subsets, all threshold values for each marker were applied to the metadata, generating another type of data that contained the number/density of cells positive for various combinations of markers in each sample. Density of immune cells with various phenotype or ratio of various immune cells can be compared according to various clinicopathologic parameters, such as EBV virus status (Fig. 4A).

In-depth computational analysis of tumor microenvironment using metadata from multiplex immunohistochemistry. Number/density of cells with a certain immunophenotype can be directly compared (A) and comprehensive analysis, including unsupervised clustering can be performed (B). EBV, Epstein-Barr virus; MSI-H, microsatellite instability–low.
More sophisticated analyses, including unsupervised clustering, can be carried out using these data. The heatmap in Fig. 4B shows the result of unsupervised hierarchical clustering; each column represents a sample and each row represents the number/density of cells positive for a combination of markers. Four clusters were identified within GC samples, where two clusters represented inflamed TME (“hot environment”; represented by green and purple group), whereas the others represented a “cold environment” (represented by light blue and dark yellow group). Clinical data, including data for overall survival, were obtained under the IRB regulation and compared; we found that all EBV+ GCs had a “hot environment.” Furthermore, we could see that two “hot” clusters had a better prognosis compared to “cold” clusters (p=0.022).
In addition, mIHC harbors advantages over single-cell sequencing because it gives spatial information as well. Guided by the staining patterns of CK, immune cells with various phenotypes can be classified into intratumoral and peritumoral categories; cells can be placed into the latter category based on their distance from CK-positive tumor cells, as shown in Fig. 5A.
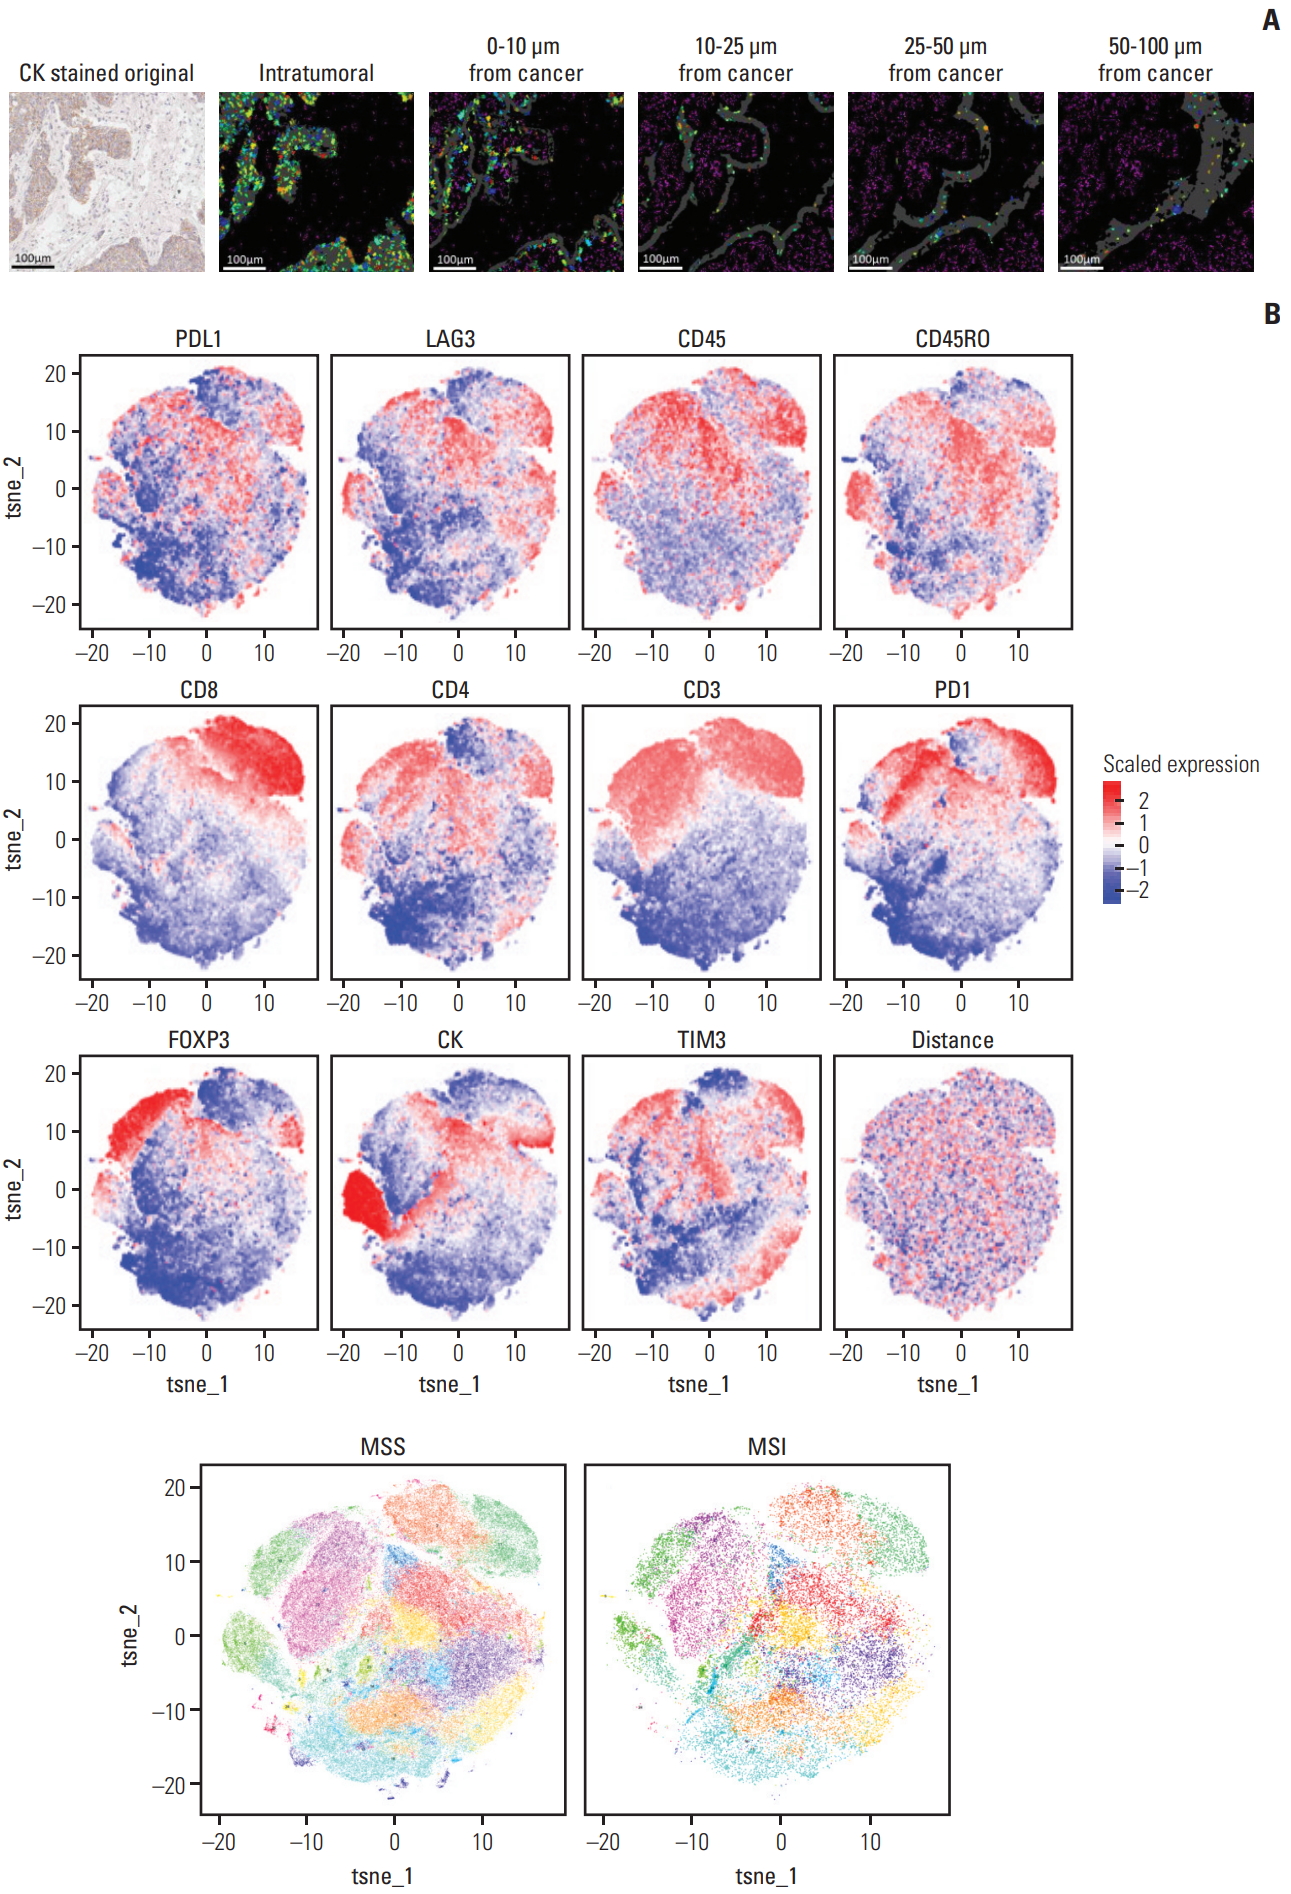
Spatial information of tumor microenvironment retrieved using multiplex immunohistochemistry. (A) Spatial relationship between tumor cells and tumor-infiltrating immune cells can be assessed by digitally analyzing the distance between cytokeratin (CK)-positive tumor cells and target immune cells of interest. Scale bars=100 μm. (B) Using the viSNE algorithm, various signatures representing each type of immune cell can be identified, and immune cell clusters based on the combination of immunostained markers can be spatially segmented into distinct subgroups. MSS, microsatellite stable; MSI, microsatellite instability.
Assessment of TME can be performed using well-known pipelines originally developed for analyses of mass cytometry data. After converting metadata into an appropriate format as described earlier, we visualized the subclusters of TME in GCs using viSNE, as shown in Fig. 5B.
2. Visualization of cell imaging at a subcellular resolution
Several molecules are known to have discrete functions depending on their subcellular location. For example, EZH2 is a methyltransferase that affects the epigenetic process by trimethylating a lysine residue on histones (H3K27); thereby, it plays a critical role in carcinogenesis and development of cancer. EZH2 can either exist in cellular cytoplasm or the nucleus, and recent studies showed that EZH2 in the nucleus is associated with tumor cell reprogramming and carcinogenesis [13]. Cytosolic EZH2 is known to have important roles in extra-nuclear signaling processes [14].
We tested whether any differences in molecular localization of EZH2 can be visualized using mIHC. Briefly, CK and hematoxylin staining was performed on the same FFPE slide. Digitalized data representing each staining can aid in differentiating cellular spaces into intranuclear, cytoplasmic, membranous, and intercellular spaces. Additional staining of a target molecule would result in staining within one of these spaces, giving information about the subcellular location of the target. We performed EZH2 immunostaining (clone 11/EZH2, BD Bioscience, San Jose, CA) and assessed its expression in the nucleus and cytoplasm (Fig. 6A), followed by correlation plotting with H3K27me3 (clone C36B11, Cell Signaling Technology, Danvers, MA) expression. As expected, higher nuclear EZH2 expression was associated with higher H3K27me3 expression (Fig. 6B). By combining various clinicopathologic features with the results of mIHC, we can get deeper insight into molecular function of a target molecule, with additional information regarding its subcellular localization.
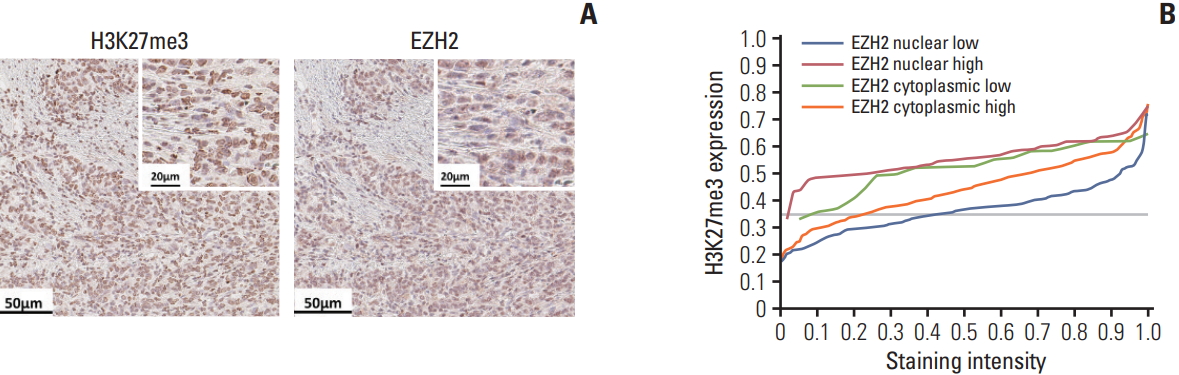
Subcellular localization of molecules using multiplex immunohistochemistry. Immunostaining of H3K27me3 and EZH2 was performed on the same slide (A) and the expression level of H3K27me3 is depicted according to the expression and subcellular location of EZH2 (B). Scale bars=50 μm (A), 20 μm (insets in A).
Discussion
In this study, we developed a novel method of sequentially staining of multiple IHC markers on a single FFPE tissue slide. We validated the usefulness of this high-throughput multiplexed immunohistochemical tissue imaging technology for the visualization of TME, and we further extended its potential application to the assessment of the subcellular localization of target molecules.
Our approach differs from multiple immunofluorescent (IF) labeling because it is based on bright-field IHC. In contrast to IF, there is no autofluorescent staining or photobleaching involved in this technique that could hinder correct interpretation of results [15-17]. In addition, more delicate and expensive devices are required for merging and stacking multiple IF images, whereas mIHC is compatible with conventional slide scanners routinely utilized in pathology laboratories.
mIHC showed excellent performance for visualization of TME using FFPE tissue slides. For the characterization of TME, previous studies implemented strategies, such as immunostaining for various markers on individual serial FFPE slides and comparing the results. Considering that the average diameter of a small lymphocyte is about 7 to 10 μm, there is high possibility that each of the 4-μm-thick serial slides would show a difference in microenvironmental information; a lymphocyte that is seen on the first slide would not be present on the third serial slide. mIHC overcomes this problem by immunostaining various markers on the same slide and aligning digitized images using computer software to further enable the accurate characterization of individual cells.
Metadata generated on the basis of immunophenotypic features of individual cells can potentially be analyzed using various methods. This metadata places “every single cell” as the basic unit for analysis; therefore, theoretically, every processing method developed for single-cell data analysis can be implemented using mIHC. Unsupervised clustering analysis enables the characterization of TME subgroups, which can be correlated with clinical data to elucidate the biological implications of microenvironmental features. For tumors of widely known molecular classification systems, such as GC [18] or breast cancer [19], supervised clustering can help define differentially infiltrated immune cells in each molecular subgroup. viSNE, SPADE [20], and Citrus [21] are more sophisticated algorithms or analytic pipelines originally developed for high-dimensional mass cytometry analyses; we proved that metadata from mIHC can be converted into input formats required in these pipelines and are, therefore, compatible for analyses using them.
The potential application of mIHC for oncology research could reach far beyond the scope of TME analysis. This method converts the results of immunostaining into digital continuous variables, unlike the semi-quantitative approach usually used for the interpretation of conventional IHC results [22]. Semi-quantitative interpretation of IHC results has been criticized for limited objectivity and reproducibility [23]. Especially, IHC using “research use” [24,25] antibodies often results in ambiguous and faint staining; therefore, semi-quantitative interpretation is difficult, due to relatively poor discrimination between categories. The output data from mIHC in continuous numeric formats enable an objective distinction between negative versus positive status for target staining by digitally setting proper cut-off values for interpretation and, therefore, helping biomarker research based on IHC technology.
Assigning multiple pseudocolors to each mIHC panel component has further aided in acquiring information, such as that for subcellular localization. Hematoxylin and CK staining clearly define the boundaries of nuclei and cell membranes, respectively, giving information on whether a certain molecule detected by IHC is located in the nucleus, cytoplasm, or cell membrane. This approach is useful for studying molecules, the functions of which depend on their cellular location.
mIHC has some limitations. Most importantly, this method is based on IHC; therefore, if the quality of IHC using certain novel biomarkers is suboptimal; integrating the marker into mIHC would not be helpful and informative. Therefore, before integration into the mIHC panel, thorough testing of antibodies under various conditions should be performed to maximize staining quality. There also exists the preconception among pathologists that multiple cycles of IHC on the same FFPE tissue slide may result in loss of antigenicity and, therefore, hinder accurate assessment of protein expression. However, Remark et al. [26] already proved that the repeated staining and destaining process does not alter tissue antigenicity. Current protocols of post-processing of scanned images involve substantial amount of time and effort; however, this limitation is actually a driving force for the development of better software and pipelines that would be helpful for efficient image analysis.
In summary, we developed a robust and feasible highthroughput multiplex imaging method that can be implemented in pathology laboratories without further installation of additional devices. We proved that mIHC can be useful for the visualization and assessment of TME for immunooncology research and that this method basically serves the role of in situ single-cell imaging. Furthermore, we extended its potential application to the analysis of subcellular localization of molecules. With additional progress regarding methods for cell segmentation, IHC intensity quantification, and high-throughput image analysis, mIHC could play more crucial roles in both research and clinical pathology work.
Notes
Woo Ho Kim, a contributing editor of the Cancer Research and Treatment, was not involved in the editorial evaluation or decision to publish this article. All remaining authors have declared no conflicts of interest.
Acknowledgements
This study was supported by grant number 04-2018-0300 from the SNUH Research Fund.