INTRODUCTION
Uterine leiomyomas are benign neoplasms, arising from the myometrial compartment of the uterus, which are the most common gynecological neoplasm in reproductive-age women (1). This benign tumor represents significant reproductive health problems, such as abnormal uterine bleeding, pelvic pain, constipation and reproductive dysfunction. It is intriguing that 60% of leiomyomatas do not exhibit a cytogenetic abnormality (2). Similarly, detailed studies of the development of leiomyoma syndromes have not been able to elucidate the etiology of leiomyoma formation in common cases (3). Recently, cytogenetic, molecular and epidemiological studies have suggested a strong genetic component to the fibroid pathogenesis and pathobiology (4). Although a number of leiomyoma-related genes and cellular processes have been studied, many of the molecular events involved in the leiomyoma pathophysiology are still unclear. Leiomyosarcomas are a common subtype of soft tissue sarcomas, which are difficult to treat when metastatic (5). Although a number of genetic changes have been observed in leiomyosarcomas, the molecular cause of the disease remains unclear.
While wide variations in the efficiency of tumor therapy among different cell types are becoming increasingly clear, there is still relatively little known regarding the mechanism by which genes, or gene complexes, are directly pathogenetic. Here, to quantitatively understand the possible multiple relationships between differentially expressed profiles of a gene and proteins, an annotation project, directed by the Gene Ontology (GO) Consortium (http://www.geneontology.org), was used (6). Despite the significance of functional analysis in tumor research, GO analysis has not been widely used in tumorigenesis, mainly due to its complexity and rapidly evolving property. With GO analysis, the regulated expression profiles are organized into three separated ontologies, comprised of; biological processes, cellular components and molecular functions, which define a set of well-defined terms and relationships by which the role of a particular gene, gene product or gene-product group can be interpreted (7). Thus, an advanced strategy for the identification of a preferential tumorspecific pathway would be possible by using GO analysis.
In this study, both cDNA microarray and 2D protein gel electrophoresis were used to obtain valuable information about the global regulation of leiomyomas and the specific pathogenetic cellular processes. The analyzed functional profiles were clearly differentiated, and disease-dependent, which resulted in a large subset of cellular functional changes being found, which could be described as tending to increase, or decrease. Also, differentially expressed genes and proteins were found to correlate with the leiomyosarcomas. A combination of the genome and proteome technologies, with GO analysis, was identified as being descriptive of the biology of leiomyomas, suggesting it to be a valuable diagnostic tool and therapeutic intervention in pathogenetic research.
MATERIALS AND METHODS
1) Samples
The uterine tissues were obtained from the involved and uninvolved tissue of six patients, according procedures approved by the Institutional Review Board of the Catholic University. The presence or absence of leiomyoma lesions was determined in all cases from the patient's medical history and clinical evaluation. None of the patients had received any hormonal medication 3 months before their hysterectomy. Preparation of tissue samples, and subsequent steps, were in accordance with the procedures previously described (8). Briefly, all patients were Korean. Tissue samples were taken within 20~30 minutes of the extirpation of the uterus, and stored in liquid nitrogen. All leiomyomas were selected from the intramural, and larger than 3 cm in their shortest dimension. Tumor-free myometrium was removed at a distance ≥2 cm from the endometrium, unless close to another leiomyoma.
2) Preparation of cDNA microarray
Each gene on the array GeneTrack Human cDNA chip, HSVC 307, provided by Genomictree Inc. (Daejeon, Korea) (www.genomictree.com), is about 0.5~5 kb cDNA, and includes a control house keeping gene, such as GAPDH, β-actin or α-tublin. Preparation of the cDNA, and the subsequent steps leading to hybridization, scanning, and data analysis, were in accordance with the BioRobotics guidelines (BioRobotics, Cambridge, UK). As a common type I experiment, two samples where directly compared on a single array, a total of 100 µg total RNA was labeled and hybridized to 17 k human microarrays. In brief, fluorescently labeled cDNA was obtained from a single round of labeling, using a kit, in the presence of fluorescent dNTP (Cy3-dUTP or Cy5-dUTP, Amersham Pharmacia Biotech, Buckinghamshire, UK). Probes and targets were hybridized together, for 16 h, in 3× SSC, at 65℃. The hybridized slides were washed once in 0.5× SSC, 0.01% SDS for 5 min, and again in 0.06× SSC for 5 min, at room temperature. The Cy3 and Cy5 fluorescence were scanned using a laser confocal microscope, and the images analyzed using ImaGene software (version 5.0; BioDiscovery, Inc., Los Angeles, CA), to calibrate the relative ratios and confidence intervals for significance determinations. In a type II experiment (9,10), a common reference RNA (Genomictree, Inc.,) was employed. Thus, the relative difference in the gene expressions could be measured to a fixed reference. The two assays had the same hybridization procedure.
3) RT-PCR
The total RNA was isolated from the tissues, as mentioned above, using Tri-reagent, and used as templates. Reverse transcription was performed, at 22 and 42℃, for 10 and 20 min, respectively, using 1.0 µg of RNA per reaction. PCR was performed with 35 cycles, as follows: 94℃ for 1 min, 57℃ for 1 min and 72℃ for 1 min, using specific primers, to obtain the PCR products. The specific primers (forward: 5'-TGACGGGGTCACCCACACTGTGCC CATCTA-3' and reverse: 5'-CTAG AAGCATTT-GCGGTGGACGGATGGAGGG-3') were used to control the gene β-actin. The amplification reaction involved 20 cycles, as follows: denaturation at 94℃ for 30 sec, annealing at 72℃ for 30 sec and 72℃ for 45 sec.
4) Analysis
The fluorescence intensities were processed, and the data then imported into an Excel (Microsoft) database, with their corresponding gene names, for analysis. For each gene, the relative fold change in their expressions was the ratio of the median expression levels of the sample versus that of the myometrium. Genes were excluded from the analyses if their expression was negative or too smeared. Genes that showed at least 2 fold differences in their expression levels were selected for a function analysis. Hierarchical clustering (Gene Cluster v 2.11) and display programs (Tree View v 1.50) were also used in the analysis (http://rana.stanford.edu/software) (11). Functional analyses were performed to classify the gene expression profiles, as previously described (12). Each gene was annotated by integrating with the information (as of October, 2003) on the Gene Ontology website (http://www.geneontology.org). Next, the gene was queried for an available Gene Ontology Code for a biological process, cellular component and molecular function.
5) 2D protein gel electrophoresis
To lyses the tissues, IEF sample buffer (7 M urea, 2 M thiourea, 4% CHAPS, 100 mM dithiothreitol (DTT) and 40 mM Tris) was added to the tissues, with thorough mixing. After centrifugation, the supernatants were collected, and stored at -70℃ until required for the 2D protein gel electrophoresis. The protein concentration was determined using a protein assay kit (Bio-Rad Laboratories, Hercules, CA). The first dimension on the 2D gel electrophoresis consisted of isoelectric focusing on a ReadyStrip IPG Strip (17 cm, pH 5~7) (Amersham Pharmacia Biotech). For this, a solution of 30 µl total protein was applied to the strip, which had been treated with the rehydration buffer (7 M urea, 2 M thiourea, 4% CHAPS, 40 mM Tris, 100 mM DTT, 0.5% (v/v) carrier ampholyte (pH 3~10) and 0.005% bromophenol blue). The gels were focused for 20 h, at 50 V, followed by 5 h, at 10,000 V, at 20℃. The strips were placed in equilibration buffer I (6 M urea, 0.375 M Tris, pH 8.8, 2% sodium dodecyl sulfate (SDS), 20% (v/v) glycerol and 2% DTT) for 20 min, and then in buffer II (6 M urea, 0.375 M Tris, pH 8.8, 2% SDS, 20% (v/v) glycerol and 2.5% (w/v) iodoacetamide) for a further 20 min, at room temperature. Subsequently, the isoelectric focusing gels were placed onto SDSpolyacrylamide gel sheets (ExcelGel XL SDS 12~14; Amersham Pharmacia Biotech) and the proteins resolved in the second dimension, with a constant current of 10 mA, at 15℃, until the bromophenol blue marker entered the gel sheets. This was followed by a second period of 15 mA, for 16 h. The gels were fixed in a fixative enhancer solution (50% methanol, 10% acetic acid and 10% fixative enhancer) and then silver-stained, as described in the manual (Bio-Rad, CA). The silver-stained gels were scanned using a scanner (GS-800, Bio-Rad). The gel images were analyzed using PDQuest 2D software, version 7.1 (Bio-Rad).
6) Mass spectrometry analysis of trytic peptides
The protein spots of interest were excised, destained in 25 mM NH4HCO3 buffer (pH 8.0, 50% acetonitrile), and cleaned in 100% acetonitrile for 5 min. After completely drying, the samples were digested with 15 µl of digestion solution (10 µg/ml Trypsin in 25 mM NH4HCO3, pH 8.0) in a 20 ml volume, at 37℃, for 20 h. The tryptic peptides were extracted with extraction solution (50% acetonitrile and 5% trifluoroacetic acid (TFA)) and concentrated by drying under vacuum. HPLC tandem mass spectrometry analysis was performed on a Voyager DE-STR mass spectrometer (Applied Biosystems). The accurately measured masses of the tryptic peptide, and its fragments, were used to search for protein candidates in the protein sequence database, with the Mascot program (http://www.matrixscience.com). To classify the protein expression profiles, functional analyses were carried out, as above described, and all of the files included the results of the experiments and of each gene.
RESULTS
1) Microarray analysis of leiomyoma-associated gene expression
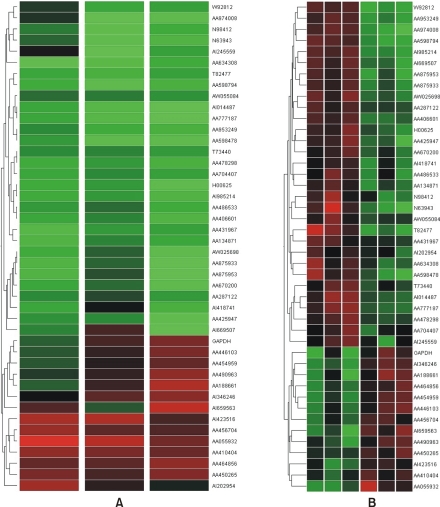
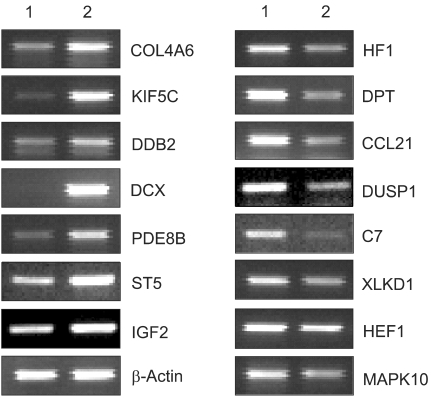
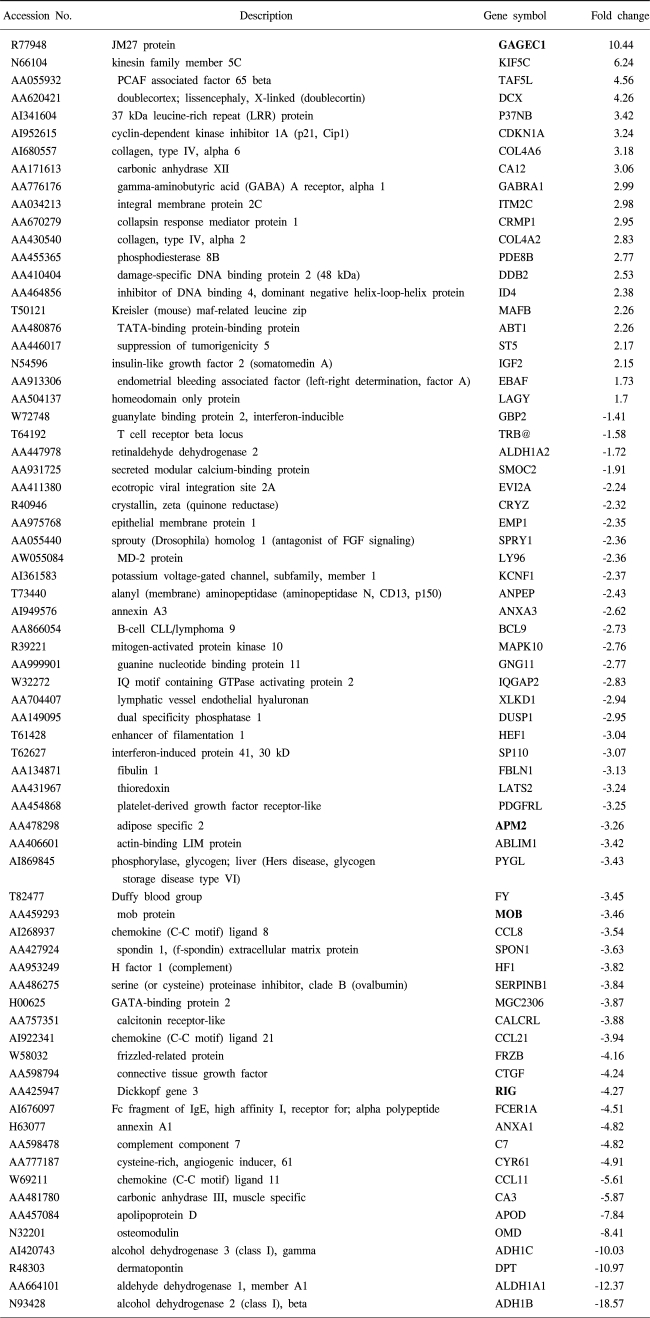
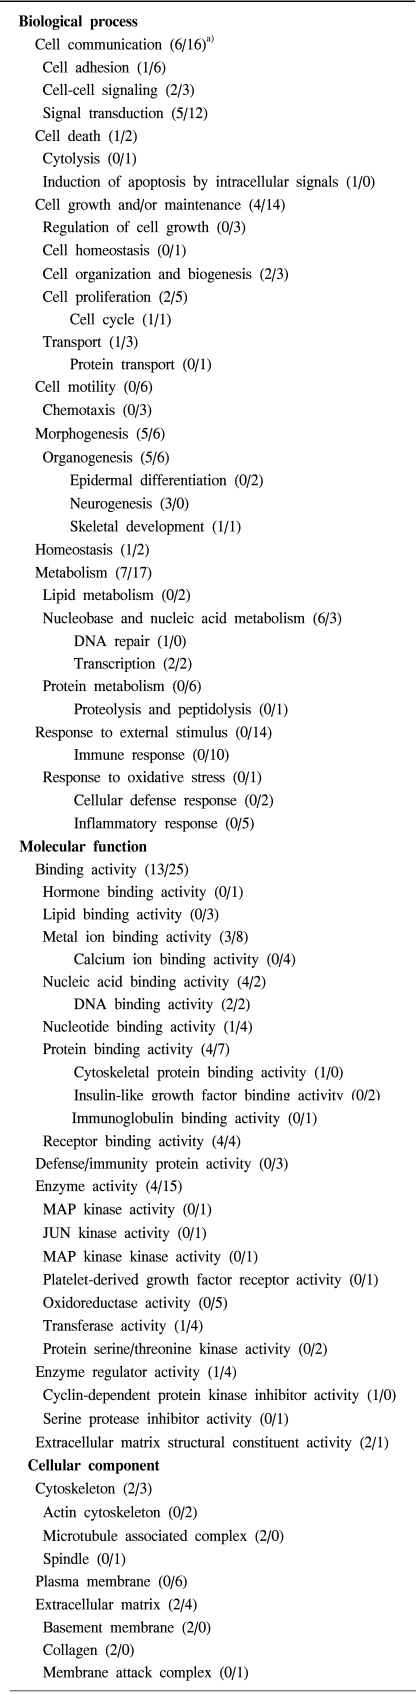
To understand the cellular process changes in the biology of leiomyomas, the differentially expressed genes in the 3-paired leiomyomas and normal myometrium were profiled by types I and II cDNA microarray assays. After the hybridization and scanning steps, the poor spots were excluded by image analysis. The analysis identified a total of 71 genes, whose expression values displayed a significant association (positively or negatively regulated) with uterine leiomyomas. In contrast, the rest of transcripts with less than a 2-fold change were excluded. As shown in Fig. 1, after the cDNA microarray analysis, the 44 consistently expressed transcripts in each sample were identified by hierarchical clustering. This showed the good consistency of the experimental repeatability. In Table 1, the genes consistently expressed between types I and II are shown. As shown in Fig. 2, RT-PCR was also performed to confirm the gene expression patterns. Several up- and down-regulated genes confirmed the patterns obtained from the microarray, and showed the consistency of the experimental repeatability. It is clear that the consistency of the experimental repeatability led to the reliable gene expression patterns in this study. As shown in Table 2, the significantly up- and down-regulated functional activities were analyzed, with respect to their biological processes, cellular components and molecular function ontologies. Of the leiomyoma-associated functional activities, over 50% of the functions were included in the biological processes, with half of these being within cell growth and maintenance.
2) Cell communication
As shown in Table 2, the transcripts involved in the cell communication (6/16, i.e., up-regulation of six transcripts, or the down-regulation of sixteen transcripts) were relatively down-regulated in the uterine leiomyomas compared to the myometrium. The cell adhesion function (1/6: COL4A6/DPT, OMD, CCL11, CTGF, HEF1, XLKD1) was repressed by the leiomyoma pathophysiology. For instance, dermatopontin (DPT) and eotaxin (CCL11), cell-to-cell attachment-related components, were highly down-regulated, indicating a decrease in the adhesive properties of leiomyoma pathogenesis. Transcripts in the signal transduction (5/12: DCX, GABRA1, PDE8B, IGF2, EBAF/CCL11, ANXA1, CCL21, CALCRL, CCL8, FY, HEF1, IQGAP2, GNG11, MAPK10, LY96 and SPRY1) showed relatively repressed expression profiles. The cell-cell signaling functions (2/3: GABRA1, EBAF/CCL11, CCL21and CCL8) were repressed by the leiomyoma-associated cellular pathway.
3) Cell growth and/or maintenance
The transcripts involved in cell growth and/or maintenance (4/14) were repressed. Especially, all the transcripts for regulation of cell growth (0/3: CYR61, CTGF and HEF1) were completely down-regulated. The transcripts involved in cell proliferation (2/5: IGF2, CDKN1A/CYR61, EMP1, EVI2A, DUSP1 and HEF1) were also repressed in the leiomyomas. The transcripts involved in transport (1/3: GABRA1/APOD, KCNF1 and CCL8), and cell organization and biogenesis (2/3: IGF2, KIF5C/CCL11, ABLIM1 and IQGAP2) were relatively down-regulated.
4) Cell motility
All transcripts for cell motility, including chemotaxis (0/6: ANXA1, CTGF, XLKD1, CCL11, CCL21 and CCL8) were completely down-regulated.
5) Development
Several transcripts involved in morphogenesis (4/6: IGF2, CRMP1, DCX, MAFB/CCL11, IQGAP2, CTGF, EMP1, SPRY1 and FRZB) were relatively balanced, where the neurogenesis in the organogenesis (3/0: CRMP1, DCX, MAFB) were completely up-regulated in the leiomyoma pathophysiology. In contrast, the epidermal differentiation (0/2: CTGF and EMP1) was completely down-regulated.
6) Metabolism
The transcripts for metabolism (7/17) were relatively repressed, such those for protein metabolism (0/6: CCL11, LATS2, MAPK10, DUSP1, ANPEP and CCL8), with those for lipid metabolism (0/2: APOD and ANXA1) completely repressed. In contrast, the transcripts involved in nucleic acid metabolism (6/3: CRMP1, PDE8B, DDB2, ID4, MAFB, IGF2/CTGF, MGC2306 and SP110) were relatively up-regulated.
7) Response to external stimulus
All the transcripts in response to external stimuli (0/14) were completely down-regulated. Especially, the immune responses (0/10: CCL11, C7, ANXA1, FCER1A, CCL21, HF1, CCL8, LY96, TRB@ and GBP2), including those to an inflammatory response (0/5) were significantly down-regulated. In addition, the responses to oxidative stress (0/1: DUSP1), viruses (0/2: CCL11, CCL8) wounding (0/1: CTGF) were completely down-regulated.
8) Binding activity
The transcripts involved in binding activity (13/25) were down-regulated. The transcripts involved lipid binding (0/3: APOD, ANXA1 and ANXA3), metal ion binding (3/8: PDE8B, CRMP1, CA12/ADH1B, ADH1C, CA3, ANXA1, FBLN1, ANXA3, CRYZ and SMOC2), nucleotide binding (1/4: KIF5C/MAPK10, LATS2, GBP2 and GNG11) and protein binding (4/7: DCX, KIF5C, ABT1, ID4/DPT, KCNF1, IQGAP2, CYR61, CTGF, FCER1A and APOD) activities were significantly down-regulated. In contrast, those for nucleic acid binding activity (4/2: DDB2, MAFB, TAF5L, ABT1/MGC2306 and SP110) were only up-regulated.
9) Enzyme activity
The transcripts involved in enzyme (4/15), hydrolase (2/5: PDE8B, CRMP1/DUSP1, GNG11, ANXA3, ANPEP and GBP2), kinase (1/3: CDKN1A/LATS2, PDGFRL and MAPK10), oxidoreductase (0/5: ADH1B, ALDH1A1, ADH1C, CRYZ and ALDH1A2), enzyme regulator (1/4: CDKN1A/SERPINB1, IQGAP2, ANXA1 and ANXA2) and transferase (1/4: CDKN1A/PYGL, MAPK10, LATS2 and PDGFRL) activities were significantly down-regulated in the leiomyomas.
10) Signal transducer activity
The transcripts involved in signal transducer (4/18), receptor (1/9: GABRA1/FCER1A, FY, ANPEP, PDGFRL, XLKD1, TRB@, LY96, FRZB, EVI2A and CALCRL), receptor binding (2/5: EBAF, IGF2/ANXA1, CCL11, CCL21, CCL8 and CTGF) and receptor signaling protein (0/4: FCER1A, MAPK10, IQGAP2 and CTGF) activities were down-regulated.
11) Structural proteins
The transcripts in the cytoskeleton (2/3: KIF5C, DCX/ABLIM1, HEF1 and IQGAP2) and extracellular matrix structural constituent (2/1: COL4A2 and COL4A6/OMD) were differentially expressed. The bone-specific osteomodulin (OMD) involved in biomineralization processes was highly down-regulated.
12) 2D analysis of leiomyoma-associated protein expression
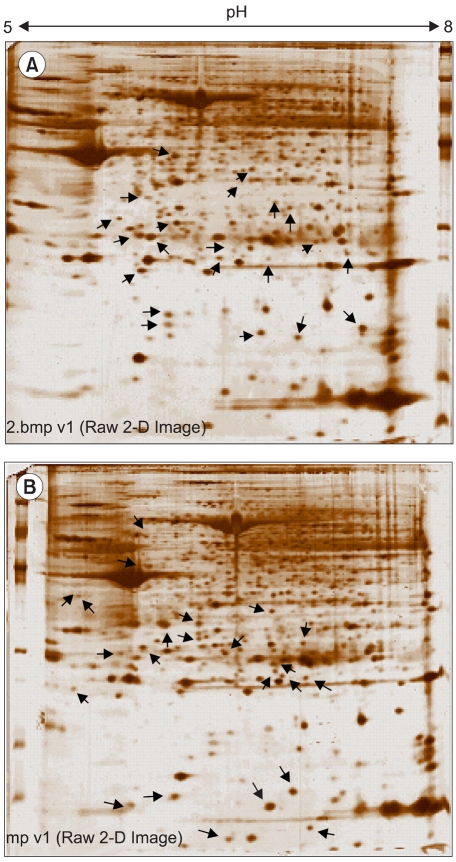
As shown in Fig. 3, the lysates prepared from the uterus tissues with, and without, leiomyomas were subjected to 2D gel electrophoresis, for the examination of the pathogenetic protein expression of uterine leiomyomas. Comparison of the spot patterns of the samples with, and without, leiomyomas, of more than 500 total spots, 33 consistently expressed protein spots were identified; 17 and 16 that were up-regulated and down-regulated, respectively. These proteins exhibited detectable quantitative changes. Table 3 shows the differentially expressed proteins, with their expression profiles. No proteins could be extracted from the corresponding spots on the cDNA microarray, due to the small number of consistently expressed proteins. In order to more systematically study if the observed protein expression profilings were leiomyoma-specific, gene ontology analyses were also applied. Table 4 shows the functional activities deduced from the gene ontology and the dependency of their expression profiles. The majority of the up-regulated functional activities turned out to be nucleic acid binding (3/0: SMARCAL1, PSMB3 and TUFM), signal transducer (3/0: CCL13, IFNA8 and OGN) and transporter (3/0: CRABP2, CLIC4 and PRDX5) activities related. In contrast, significant down-regulation was shown in muscle development (0/5: ACTA1, ACTA2, ACTC, ACTG2 and TAGLN). These proteins were also involved in the down-regulation of actin cytoskeleton, cytoskeletal protein binding and motor activities. The cell motility activity (0/4: ARPC5, ACTA1, ACTC and CRYAB) was also completely down-regulated. Several functional activities, such as response to external stimulus (3/4) and extracellular matrix (2/2), remained unchanged, indicating that these functions were leiomyoma-independent. Further identification of leiomyoma-dependent protein products was found to be difficult, as no other candidate spots, containing sufficient amounts of protein for the determination of their masses, could be separated in a pure enough form from the surrounding spots on the 2D gels.
DISCUSSION
To systematically understand the cellular process changes in leiomyomas, the techniques of cDNA microarray, 2D protein gel electrophoresis and Gene Ontology analysis were combined. The comparison of the cDNA microarray and proteomic analytical results showed large discrepancies between the mRNA and protein levels, as discussed previously (13). Potential leiomyoma-related genes, found through microarray analysis, were somehow proven to be relevant, as no other candidate protein spots, containing higher than 10, or lower than 5, pH values, and lower detection limits for the determination of their masses, could be easily excluded from the 2D gel analysis. There was good agreement between our observations and those in other studies for some of the genes, and this greatly increases the reliability of the results for these genes, such as DCX, IGF2, ADH, KIF5C and CDKN1A (8,14). The potentially significant genes of unknown function, in bold type, are also shown in Table 1. Of these genes, the up-regulated GAGEC1 is a member of the GAGE family. This gene is strongly expressed in the prostate and in prostate cancer, but is also expressed in testicular and uterine cancers (15). The protein encoded by LAGY is also known to be a lung cancer-associated protein. Future studies will be required to clarify the regulatory mechanism of these genes, and their roles in uterine leiomyoma development. Closer examination of the transcriptomes and proteoms, using Gene Ontology, resulted in a number of reciprocally dependent cellular processes, revealing several corresponding functional activities to be pathogenesis-related. Especially, several down-regulated leiomyoma functions, such as structural molecule and extracellular matrix adhesion molecules, were in agreement with other observations (16). Of the corresponding functions, the down-regulated functions were more abundant than those up-regulated; indicating that repression of cellular processes may have an important impact on uterine leiomyoma pathogenesis.
The down-regulated cell adhesion activity indicates a decrease in the adhesive properties in leiomyomas. For instance, down-regulated eotaxin (CCL11), a potent inducer of eosinophil chemotaxis, leading to eosinophil migration in vitro, and accumulation in vivo, is not able to take part in the fine-tuning of the cellular responses occurring at sites of allergic inflammation, where both monocyte chemotactic protein-1 (MCP1) and eotaxin are produced (17). In transgenic mice, which overexpressed CTGF and embryonic and neonatal growths were reported to occur normally, indicating that the down-regulated CTGF in this study may cause a malfunction of the embryonic development. In contrast, overexpressed type IV collagen alpha 6 (COL4A6), the major component of basement membranes, is only used in generating unique basement membrane structures in different tissues (18).
Of the completely down-regulated cell motility functions, ANXA1 has been reported to act, through the formyl peptide receptor, on human neutrophils (19). Peptides derived from the unique N-terminal domain of ANXA1 serve as FPR ligands, and trigger different signaling pathways. By down-regulation of ANXA1, lower peptide concentrations may cause a specific inhibition of the transendothelial migration of neutrophils, and their desensitization toward a chemoattractant challenge, leading to loss of the anti-inflammatory effects. XLKD1 appears to be involved in the sequestration, or transport, of hyaluronan, an abundant extracellular matrix glycosaminoglycan in skin and mesenchymal tissues, where it facilitates cell migration during wound healing, inflammation and embryonic morphogenesis. In this study, XLKD1 was down-regulated, which led to the loss of anti-inflammatory effects (20).
It is well known that gynecologic disease can be induced by abnormal immunogenetic changes of the genes involved in tissue regeneration, such as matrix metalloproteinase, cytokines and growth factors. Of the responses to external stimulus function, significantly down-regulated transcripts serve as an important malfunction in the immune response, as follows; eosinophil specific chemokine (CCL11) and IgE receptor (FCER1A) are known to be involved in eosinophilic inflammatory diseases, such as atopic dermatitis, asthma and parasitic infections (21). C7 is a component of the complement system. People with down-regulated C7 are prone to recurrent bacterial infections (22). As with other chemokines, the protein encoded by CCL21 inhibits hemopoiesis, and stimulates chemotaxis. This protein is chemotactic in vitro for thymocytes and activated T cells, but not for B cells, macrophages or neutrophils. The cytokines encoded by CCL21 may also play roles in mediating the homing of lymphocytes to secondary lymphoid organs. CCL8 displays chemotactic activity for monocytes, lymphocytes, basophils and eosinophils. By recruiting leukocytes to sites of inflammation, this cytokine may contribute to tumor-associated leukocyte infiltration.
Transcription is a complex category, which can lead to global alterations in the whole network of gene expressions. These transcriptional regulators are expected to be highly relevant in the leiomyoma pathophysiology, and their regulation may affect different cellular functions. For instance, up-regulated TAF5L, expressed in most tissues, functions in promoter recognition or modify general transcription factors (GTFs), facilitating complex assembly and transcription initiations. It also inactivates platelet-activating factor (paf), by removing the acetyl group at the sn-2 position. Its aberrant overexpression may serve to repress other downstream pathways, which further contribute to the development of diseases. Conversely, the transcriptional activators, MGC2306 and SP110, which regulate the endothelin-1 gene expression in endothelial cells, were repressed. In this study, no transcripts in the protein translation or biosynthesis functions were expressed. Thus, it can be suggested that leiomyomas may not increase the turnover of many proteins, which could be due, either to a lesser activity of the replacement of damaged molecules, or to the nature of the benign tumor itself, compared to that of leiomyosarcomas (23). The genes most overexpressed in the leiomyosarcomas were doublecortin, osteopontin, CRABP2 and the CDKN family, which were all overexpressed in this study. However, these genes were overexpressed 5- to 20-fold more than in the leiomyomas. While the ADH1C and ADH1B were downregulated more than 10-fold in the leiomyoma, the ADH1A and ADH1B were downregulated more than 5-fold in the leiomyosarcomas. CDKN2A was found to be specifically, and significantly, overexpressed in the leiomyosarcomas, which was consistent with our study. CDKN2A has been noted as a tumor suppressor, with mutation, or loss, of CDKN2A, and has similar effects on the cell cycle progression (24). Conversely, the overexpression of IGF2 was observed in the leiomyomas in our study, but this gene has been found to be downregulated in leiomyosarcomas (23). Thus, the low levels of ADH1A, IGF2 and CDKN2A expressions could be important representative markers for the development of leiomyosarcomas. Several transcripts that code for cellular structure proteins were found to have changed their expressions in the uterine leiomyomas. Transcripts in this category can be subdivided into two groups; cytoskeletal- and nuclear-related genes. It has been known that the cytoskeleton integrity plays an important role in cell cycle progression, death and differentiation. Abnormal cytoskeleton functions are often observed in cancer cells. Notably, HEF1, highly expressed in normal endometrium in uterus, was down-regulated in this study. HEF1 is an important component of a cytoskeleton-linked signaling pathway, initiated by integrins. Transformation of cells, with the oncogene Abl, results in tyrosine phosphorylation of HEF1, which is mediated by the direct association between HEF1 and Abl, which leads to the speculation that HEF1 may be an important linking element between extracellular signaling and regulation of the cytoskeleton. ABLIM1, highly expressed in ovary bulk tumor, was also down-regulated, which plays key roles in the regulation of developmental pathways.
A literature survey revealed several reports of leiomyomarelated transcripts, with regard to the transcripts themselves, or products that contain them as constituents. Of these, IGF2 was reported to be over-expressed in leiomyoma development, as a consistent, in this study (8). Recurrent hypoglycemia in women with leiomyosarcoma is known to be as a result of the overexpression of IGF2 by tumors (25). It has also been reported that CYR61 and CTGF have significant sequence homologies to insulin-like growth factor binding proteins, and contain a von Willebrand factor type C repeat, thought to be involved in the deactivation of a genetic programmed for wound repair, in skin fibroblasts, via the reduction of CYP61.
CONCLUSIONS
Gene expression changes and differentially expressed proteins in the uterine leiomyomas were identified, and were found to correlate with the leiomyosarcomas. The potentially significant pathogenetic cellular processes were also identified using Gene ontology analyses. Our most interesting finding was that the GO analysis can describe the cellular processes occurring in the biology of uterine leiomyomas, and overcomes the complexity of the expression profiles. Thereby, valuable prognostic candidate genes, with real relevance to disease-specific pathogenesis, can be found at the cellular process level. Further systematic omic approaches, including genome-wide analyses using GO, can certainly elucidate new connections between the pathogenetic profiles of leiomyomas and leiomyosarcomas.