INTRODUCTION
Health-related quality of life (HRQOL) is an important outcome parameter of cancer treatments, which is considered by clinicians, clinical investigators, funding agencies, pharmaceutical companies, and the US Food and Drug Administration, as well as by the patients and their families. Thus, it is essential to quantify the HRQOL in cancer clinics and clinical trials. Even though there is no universally accepted definition for HRQOL, it is generally assumed to have multidimensional constructs, with dimensions broadly related to health, such as physical, psychological and social functioning and symptoms (1). Within the context of the multidimensional constructs, several cancer-specific QOL measurements have been developed over the last decade.
The QLQ-C30 was designed by the European Organization for Research and Treatment of Cancer (EORTC) to be cancer specific, multidimensional in the underlying constructs, appropriate for self-administration and applicable across a range of cultural settings (2). The questionnaire was framed as consisting of five functioning domains (scales), three symptom domains, a global health status/QOL domain, and six single items. The hypothesized multidimensionality of the QLQ-C30 constructs was originally tested in cross-cultural samples of lung cancer patients, mainly in Western Europe, North America and Australia, and has since been tested with other types of cancer patient and in many other countries. However, some scaling errors and a lack of distinctiveness between scales have been reported (1~4). Previous studies have mainly used multitrait scaling analysis or/and interscale correlations to assess the underlying constructs; factor analysis, a key part in the measurement of constructs (5,6), has only rarely been performed. Multidimensional scaling (MDS) has recently been recommended for studying the QOL as a geographical-complementary method tool for clustering items lying fairly close to each other in spaces, with at least two dimensions (7). Assessment of its accuracy requires confirmation of the underlying constructs of the QLQ-C30, with an extended range of methods beyond those used previously. Therefore, the present study evaluated the multidimensional constructs of the QLQ-C30 in Korean patients with cancer, using factorial and MDS analyses, as well as the commonly used multitrait scaling method and interscale correlations.
MATERIALS AND METHODS
1) Sample and data collection procedures
A sample was recruited from a university hospital in a Suwon city, South Korea, after obtaining the approval of the institutional review board. The inclusion criteria for the subjects were a diagnosis of the most common types of cancer in Korean (stomach, lung, liver, breast, and cervix), age over 18 years, with no psychiatric problems, and articulate in Korean. Potential subjects were identified by the provider nurses or physicians. Those who wished to participate were met in a small private room while waiting to be seen by their physicians. During the contact, the purpose of the study and nature of participation were outlined by two trained graduate nursing students. If a patient articulated an understanding of the study and agreed to participate, he or she was asked to sign a consent form and then complete the QLQ-C30 (version 3) questionnaire. The trained graduate students were available to answer any questions that the patient had whilst completing the questionnaire.
2) Instrument
The QLQ-C30 was a 30-item cancer-specific questionnaire for measuring the HRQOL in cancer patients. It included five functioning scales (physical, PF; role, RF; cognitive, CF; emotional, EF; and social, SF), three symptom scales (fatigue, FA; pain, PA; and nausea and vomiting, NV), a global health status/QOL scale (GL), and six single items (dyspnea, appetite loss, sleep disturbance, constipation, diarrhea and financial impact of the disease and treatment) (2). All items employed a 4-point Likert scale, ranging from 1 to 4, with the exception of two items in the GL scale, which used 7-point scales. In this study, the Korean version of the QLQ-C30, translated by the EORTC, was used, with permission. In addition, the sociodemographic variables of age, education level, income and marital status were measured, and the clinical variables of type of cancer, disease stage and treatment state were collected from case records.
3) Data analyses
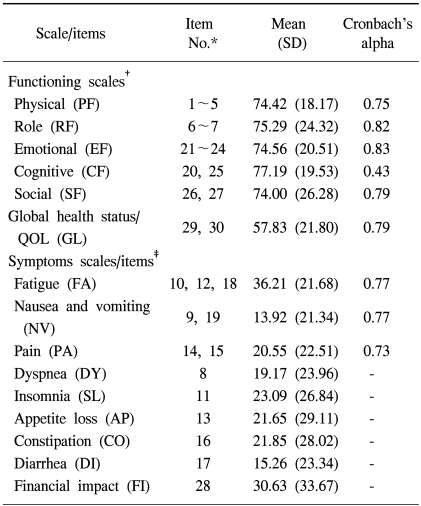
The Statistical Package for the Social Sciences (SPSS) was used to analyze the obtained data. Descriptive statistics of the raw data were used for item-level analyses of the frequency distribution of responses and the percentage of missing values. All the raw scores for the scale/single items were linearly transformed to values between 0 and 100. The mean and standard deviation of each scale/single item were computed. A higher score for a functioning scale represented a more healthy level of functioning, a higher score for the GL represented a higher QOL, and a higher score for a symptom scale/item represented a worse level of symptomatology. The Cronbach's alpha of each scale was also calculated.
The multidimensional constructs of the questionnaire were evaluated in four ways: multitrait scaling analysis, interscale correlations, factor analysis and MDS, with nine scales (5 functioning scales, 3 symptom scales and a GL scale). A multitrait scaling analysis was performed based upon item-scale correlations. Pearson's correlation coefficients of an item with its own scale (corrected for overlap) and other scales were calculated. Evidence of item convergence validity was defined as a correlation above 0.40 with its own scale. Item discriminant validity was assessed by comparing the magnitude of the correlation of an item with its own scale compared to that with all other scales. A definite scaling error was considered to be present when a correlation of an item with another scale exceeded the correlation with its own scale by two standard errors. A probable scaling error was considered to be present when a correlation between an item and another scale exceeded the correlation with its own scale, but by less than two standard errors (2,6). Pearson's correlations were used for interscale correlations. If the Pearson's correlation coefficient was more than 0.60 between scales, they were considered to be conceptually related, so that collapsing those two scales may be possible (8,9). For factorial constructs, a principal factor analysis, with varimax rotation, was used. Before the factor analysis, the Kaiser-Meyer-Olkin (KMO) test and Bartlett's test of sphericity were performed to justify the suitability of data for a factor analysis (10). Factors with an eigenvalue greater than one were retained (11). The loading criterion was set at an absolute value of at least 0.40 (12). Cronbach's alpha (>0.70) was used to evaluate the factor's internal consistency and decide where to best place an item with significant loadings (absolute value >0.40) on more than one factor. Since negative correlations can drastically affect the Cronbach's alpha value, negative correlations of the items of the symptom scales were changed into positive correlations of equal magnitude by their reverse-coding (13). MDS was used as a complementary method of assessing the item loadings on factors; this is a graphical method in which a set of items is presented by a set of points in a space, with at least two dimensions (7).
RESULTS
1) Characteristics of subjects
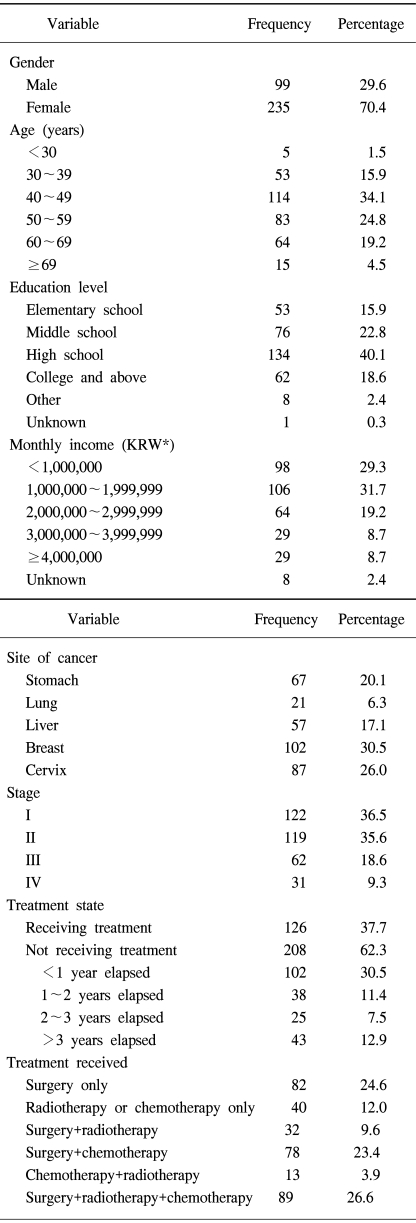
The age of the patients ranged from 23 to 81 years, with a mean of 50.26 (SD=11.02) years. In terms of medical characteristics, 102 (30.5%) of the patients had breast cancer, with the majority in stages I or II, were not currently receiving treatment, and had received more than one type of treatment (Table 1).
2) Item- and scale-level descriptive statistics and Cronbach's alpha
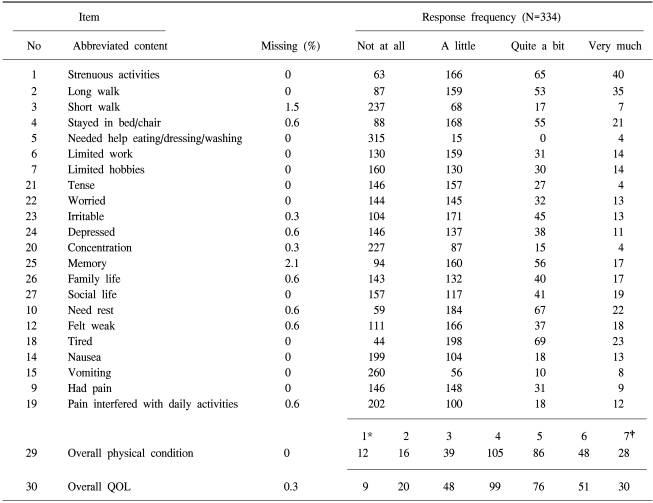
Table 2 lists the item-level descriptive statistics. The rates of missing values for each item of the QLQ-C30 were low, at 0~2.1%. Items 3, 5, 20 and 15 exhibited skewed distribution of responses, with the majority of patients responding with "not at all." Table 3 lists the scores of the assumed scale/single items and Cronbach's alpha on the QLQ-C30 questionnaires. The Cronbach's alpha of the CF scale was less than 0.70, indicating that the items were not measuring the same attribute.
3) Multitrait scaling
Table 4 shows item convergent and discriminant validities. The correlation coefficient between each item and its own scale (item convergent validity) was above 0.40 for all items, with the exception of items 5, 20 and 25. With regard to the item discriminant validity, there were seven definite and three probable scaling errors in the CF scale and one probable scaling error in the PF scale. The rate of definite scaling errors was 3.6% (7/192).
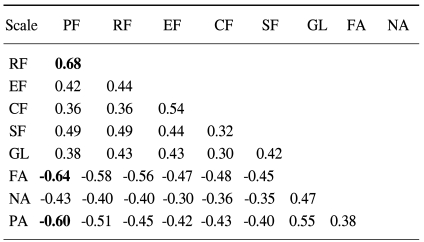
4) Interscale correlations
In the interscale correlation matrix (Table 5), the absolute magnitude of correlation coefficients ranged from 0.68 to 0.30, with the highest values applying to the PF and RF scales. The correlations between the PF scale and the FA and PA scales were -0.65 and -0.60, respectively (the negative values are due to the different directions of scorings on the functioning and symptoms scales).
5) Factor analysis
The value of the KMO measure of sampling adequacy was 0.92, which was very high for a factor analysis. The Bartlett's test of sphericity produced X2=3583.80 (p=0.000), indicating that the obtained data were suitable for a factor analysis (10,11). The factor analysis extracted a five-factor solution based on the criterion of an eigenvalue greater than one; these five factors explained 59.68% of the total variance.
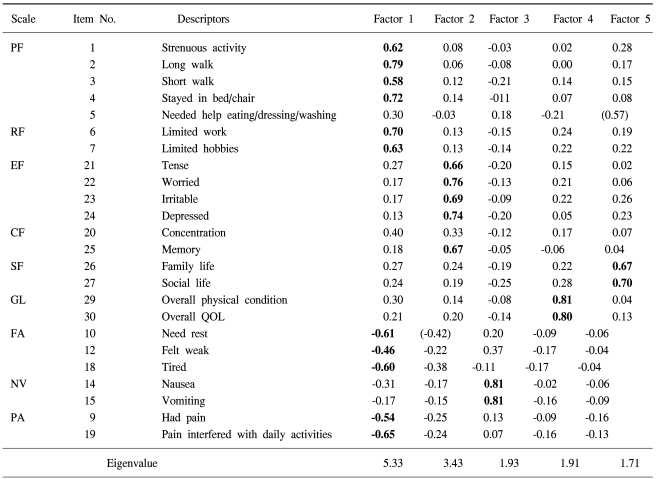
The loadings of items on the extracted factors are presented in Table 6. All items, with the exception of item 20 loaded significantly on at least one of the five factors. All items on the PF (except for item 5), RF, FA and PA scales significantly loaded the first factor, at an absolute value of at least 0.40. The Cronbach's alpha of the items was 0.90 (negative correlations of the items of the FA and PA scales were changed into positive correlations of equal magnitude by their reverse-coding), indicating that the significantly loaded items within factor 1 appeared to measure the same attribute.
All items in the EF scale, item 25 in the CF scale, and item 10 in the FA scale were significantly loaded on factor 2. Item 10 significantly loaded on either factor 1 or 2, and so the Cronbach's alpha was calculated to determine the best allocation of this item: its value for factor 1 was 0.90, including item 10, but 0.89 excluding this item, and for factor 2 was 0.83, irrespective of whether item 10 was included. Thus, it was better to place item 10 on factor 1 than factor 2
All items on the NV scale and the overall GL significantly loaded on factors 3 and 4: the Cronbach's alpha values were 0.77 and 0.80, respectively.
All items on the SF scale and item 5 on the PF scale significantly loaded on factor 5. The Cronbach's alpha of factor 5 was 0.65, but increased to 0.79 when item 5 on the PF scale was deleted. Thus, it was better not to include this item on factor 5.
6) Multidimensional scaling
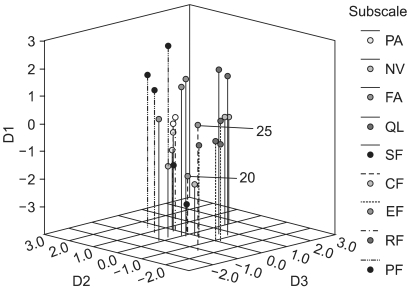
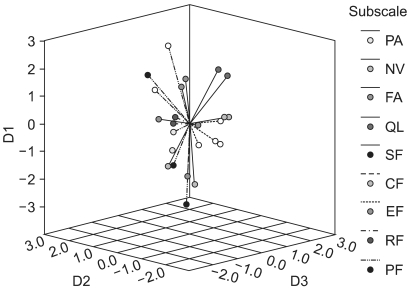
MDS was performed to quantify the dissimilarities between all the items due to their Euclidian distance in a low-dimensional space. Fitting MDS solutions yielded an s-stress value of 0.18 for a three-dimensional (3D dimensional) solution. In Fig. 1, items belonging to the same scale-as hypothesized by the developers of the QLQ-C30-are marked in the same color, indicating the relations between scale membership and an item's position in the 3D space. Items in each of the QL, SF and EF scales were tightly clustered and clearly distinct from the other items. Items in the NV scale were clustered more widely, but still distinctively. Items 20 and 25 in the CF scale were located far from each other. Item 5 did not clearly fit into the cluster of its respective scale, PF. Items in each of the FA and PA scales were tightly clustered, but were all within the wide cluster of the PF scale and; hence, did not appear to be distinguishable from the PF scale. Fig. 2 shows the centroid of the MDS map, positioned on the empty place of the 3D solution.
7) Ancillary analysis
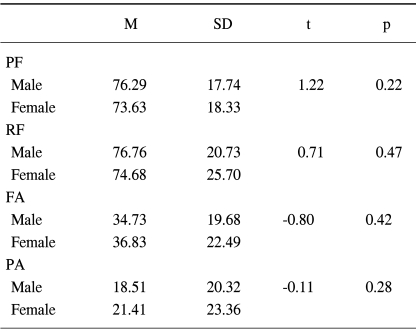
The present study included 235 females (70.4%), due to the inclusion of patients with woman-specific cancers, such as breast or cervix cancer. Thus, t-tests were computed to identify whether the gender related to the PF, RF, FA and PA scales, which were a problematic construct in this study. Table 9 shows that there were no significant mean differences of the PF, RF, FA and PA scales according to gender.
DISCUSSION
The present study evaluated the multidimensional constructs of the QLQ-C30, using a multitrait scaling method, interscale correlations, factor analysis and MDS. The frequency distribution of responses (Table 2) revealed that the response choices available in items 3, 5, 15 and 20 were not fully used. This may reflect a translation problem or the differing medical characteristics of the patients. For example, the abbreviation "TV" in item 20 was not translated into the Korean equivalent (instead it was kept as "TV"); so that some patients with a low education level and of advanced age had to ask the data-collecting assistants to explain this term. The majority of the patients in the study were in a relatively early stage of their condition, and not currently receiving treatment. Thus, they may have experienced few limitations to daily activities, with little experience of vomiting. It is; therefore, recommended to include items 3, 5, 15 and 20 in order to measure the full range of the HRQOL constructs (6).
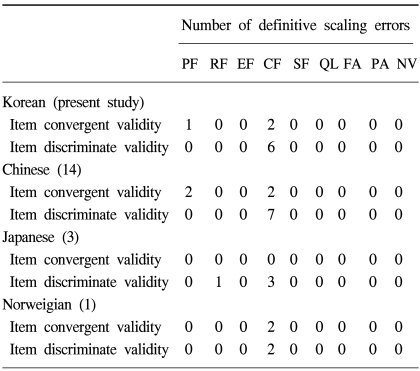
The multitrait scaling analysis in this study (Table 4) roughly confirmed the hypothesized underlying the constructs of the QLQ-C30. However, several scaling errors were identified. The weakest scale was that of CF, which did not satisfy the item divergence validity. A similar result was found in previous studies involving Japanese lung cancer patients, Chinese cancer patients and Norwegian head and neck cancer patients (Table 7) (1,3,14). The fifth item in the PF scale was also somewhat problematic, and did not satisfy the item convergence validity. The low correlation coefficient of this item with its scale (r=0.28) might have been due to the skewed frequency distribution of the responses (315 patients responded with "not at all") (Table 3); this problem has been reported previously (1,4,14).
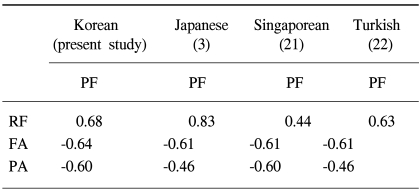
When developing the QLQ-C30, the EORTC noticed that some of the scales might be correlated with one other; however, the magnitude of the correlations only has to be moderate (r≤0.35) for the scales to be considered distinct (15). The correlation between the PF and RF scales in the present study was relatively high (Table 5), and was consistent with the values from other studies (Table 8) (1,21,22). This indicates that the two scales may not be separable, and some authors have recommended combining the PF and RF scales into one scale or adding RF-related items if the RF scale is to be kept as a distinctive QLQ-C30 dimension (16). Kemmler and colleagues stated that the RF scale included limitations in performing work or household jobs and; thus, was fairly closely linked with the PF scale (17).
McLachlan and colleagues (18) noted that the RF scale in the QLQ-C30 needed to include role limitations due to mental problems or job satisfaction, given that this scale currently includes only role limitations due to physical health. The magnitudes of the correlations between the PF scale and the FA and PA scales in this and other studies (Table 8) were relatively high, suggesting that these three scales are not distinctive. In a similar vein, the QOL model by Ferrell and colleagues viewed physical functioning ability and symptoms (e.g. fatigue and pain) as an identical domain rather than as separate domains (19).
The factorial construct analysis revealed fair agreement with the originally hypothesized constructs of the QLQ-C30. Factors 2, 3, 4 and 5 were almost identical with the hypothesized EF, NV, GL and SF scales, respectively. The minor difference was that item 25 clustered with the EF scale. A similar result was also reported in a study involving Canadian breast cancer patients (18). In a study using a factor analysis, the items in the EF and CF scales of the QLQ-C30 were loaded on one factor, newly named the "emotional distress" factor. The main difference was that the PF scale (except item 5) and the RF, FA and PA scales were clustered together on factor 1, which was consistent with the interscale correlations (Table 5).
MDS has the advantage of providing additional insight into the correlational structure of the QOL instruments (7). Our 3D MDS map (Fig. 1) clearly showed that items in each of the SF, GL, EF and NV scales were tightly clustered and clearly distinct from the other items, which supports the above results of the factorial analysis in the present study. The centroid of the 3D MDS map (Fig. 2) was not positioned on the GL scale. That is, the GL scale may not represent the global aspect of the items on the QLQ-C30, but rather may reflect the attributes of QOL not covered by the functioning scales (PF, RF, EF, CF and SF) and symptom scales (PA, FA and NV). If so, further study will be required to determine the concrete attributes of the abstract meanings of the GL items "overall physical condition" and "overall quality of life."
CONCLUSIONS
The present study indicates that the constructs of the QLQ-C30 reasonably support the originally hypothesized underlying multidimensional constructs in the Korean population with cancer. In particular, the SF, EF, GL and NV scales were found to be identical with the hypothesized underlying constructs. However, the PF and RF scales were not distinctive, and the CF scale was somewhat problematic. The HRQOL constructs may be influenced by the cultural background of the subjects (20); therefore, we suggest that analogous studies, employing various methods for assessing multidimensional constructs of HRQOL, are performed in other cultures.