Introduction
The prognostic role of the education level (EL) in breast cancer is largely unknown. Although the EL has occasionally been suggested to be a prognostic factor for breast cancer, previous studies have not provided consistent results on this relationship. Some papers reported that a higher EL was associated with higher survival rates [1-4] but others reported no correlation between the EL and breast cancer survival [5-7]. Furthermore, some papers presented totally opposite results, suggesting that patients with a high EL had a higher mortality [8-11]. Therefore, more evidence is needed to determine the role of the EL as a prognostic factor for breast cancer.
Although the EL is a significant prognostic factor in breast cancer, there is very little information on the relationship between the EL and the prognosis of breast cancer. Only a few papers have investigated the relationship between the EL and breast cancer prognosis directly [2,5,10], and the other papers have dealt with the EL or breast cancer as a part of their investigation, e.g., breast cancer as a part of all cancers, or the EL as a part of the socioeconomic status. Most papers only reported the hazard ratio or relative risk of the EL with respect to mortality in breast cancer, and they seldom reported further analyses of the relationship between the EL and breast cancer prognosis. For example, there is little information on the following question: “To which subgroup of breast cancer patients could the prognostic impact of EL be applied?”
Although some studies stated that the EL was a significant prognosticator in breast cancer, they barely described the plausible causality regarding how the EL can affect the prognosis of breast cancer. Many possible confounding factors between the EL and breast cancer prognosis can make it difficult to interpret the EL as a prognostic factor on its own. Therefore, it is essential to adequately adjust for these confounding factors for precise analyses of the relationship between the EL and the breast cancer prognosis. Furthermore, as a relatively small number of enrolled subjects have been the major obstacles to the establishment of the EL as a prognostic factor, an adequate number of subjects are needed to maintain the statistical power of subgroup analyses, which could be used to determine the effects of various confounding factors on the EL as a prognostic factor for breast cancer. In this study, an attempt was made to categorize the confounding factors that could be associated with the EL into three groups: biological factors, treatment factors, and other factors. The biological factors cover the clinicopathologic factors, including age, body mass index (BMI), tumor size, nodal positivity, stage, hormonal receptor (HR), human epidermal growth factor receptor 2 (HER2), histologic grade, and lymphovascular invasion. The treatment factors include the operation period, surgery, radiation therapy, chemotherapy, and hormonal therapy. Other factors include all factors other than biological and treatment factors.
Currently, adjuvant treatments for breast cancer are planned based on the molecular subtypes according to the expression of the estrogen receptor, progesterone receptor, and HER2. The prognostic impact of the EL on each molecular subtype of breast cancer has not been reported. Therefore, it is necessary to examine the prognostic impact of the EL on each molecular subtype.
Since 1996, the Korean Breast Cancer Society has collected nationwide data for breast cancer patients in the Republic of Korea by developing the Korean Breast Cancer Registry program, and a large amount of data has been accumulated [12]. This study attempted to validate the role of the EL as a prognostic factor for breast cancer, and carry out subgroup analyses using this database. The causality between EL and breast cancer through which the EL can affect the prognosis of breast cancer and the prognostic effect of EL on the molecular subtypes of breast cancer were also investigated.
Materials and Methods
1. Patients
The Korean Breast Cancer Society has collected nationwide breast cancer data prospectively since 1996; retrospective data collection was also allowed when a participating hospital had its own breast cancer database. The total number of patients registered in the Korean Breast Cancer Registry at the time of this study was 156,632. Because the survival data had been updated up to December 31, 2014, 4,689 patients, who underwent surgery after January 1, 2015, were excluded. After further excluding 78,987 patients because of a lack of information on education (956 patients with stage IV at the initial diagnosis, and 7,871 patients with a Tis lesion) the data of 64,129 patients were finally analyzed. The institutional review boards approved this study.
2. Definitions of education period and EL
The education system in South Korea consists of five programs; 6 years of elementary school, 3 years of middle school, 3 years of high school, 2 or 4 years of college or university, and more than 2 years of graduate school. The education period was divided into five groups according to the length of the education period: the no diploma group (< 6 years), elementary school group (6-8 years), middle school group (9-11 years), high school group (12-13 years), and college group (≥ 14 years). The EL was classified further into two groups: the high EL group (≥ 12 years) and the low EL group (< 12 years). In this study, kindergarten or preschool programs were excluded.
3. Clinicopathologic parameters
The patients’ ages were defined as the age at the time of the diagnosis of the primary breast cancer. The TNM staging was described according to the seventh edition of the American Joint Committee on Cancer. The HR status was defined as positive when the immunohistochemistry tests for either estrogen or progesterone receptors were positive, and was defined as negative when both tests were negative. HER2 was defined as negative when the immunohistochemistry results were negative or 1+, and positive when the results were 3+. When the results were 2+, the positivity of HER2 was defined according to the results of fluorescence in situ hybridization. The histological grade was defined using the modified Scarff-Bloom-Richardson grading system. Lymphovascular invasion was defined as positive when either lymphatic invasion or vascular invasion was positive, and as negative when both tests were negative. The BMI was defined as the ratio of the body weight in kilograms to the square of the height in meters. All operations with curative intent for breast cancer patients were classified as breast conserving surgery or total mastectomy according to the extent of surgery for the breast tissue. The molecular subtypes were classified into four categories, including HR(+)/HER2(–), HR(+)/HER2(+), HR(–)/HER2(+), and HR(–)/HER2(–) according to the expression of HR and HER2.
4. Statistical analyses
A two sample t test and Pearson’s chi-square test were used to determine the differences in the clinicopathologic characteristics between pairs of groups. The p-value for the trend was calculated using the linear by linear association test in a Pearson’s chi-square test. All survival analyses were carried out with respect to the overall survival, and the time duration of the overall survival was defined as the time from surgery to death from any cause. The Kaplan-Meier estimator was used to analyze the survival rates and a log-rank test was used to determine the significance of the differences between two or more survival curves. A Cox-proportional hazards model was used for univariate and multivariate analyses, and the HR was calculated using a 95% confidence interval (CI). All statistical analyses, except for the forest plot, were carried out using IBM SPSS Statistics ver. 20.0 (IBM Corp., Armonk, NY), and the forest plot was produced using Microsoft Excel (Microsoft Office Professional Plus 2010). All tests were two-sided, and a p-value of < 0.05 was considered significant. The biological model, treatment model, and combined model were designed for multivariate analyses. In the biological model, nine factors, including age, tumor size, node positivity, stage, HR, HER2, histologic grade, lymphovascular invasion, and BMI, were used to adjust for the EL. In the treatment model, five factors, including the operation period, operation, radiation therapy, chemotherapy, and hormonal therapy, were used. In the combined model, all fourteen factors described above were used.
Results
1. Clinicopathologic characteristics
The total number of subjects was 64,129, and the mean age of all subjects was 49.8±10.7 years. Their operation dates were between January 1987 and December 2014, and the mean follow-up period was 71.3±51.7 months (range, 0 to 335 months). The total number of deaths during the period was 6,010 (9.4%). According to the length of the education period, the high school group showed the highest frequency (n=25,464, 39.7%), followed in order by the college group (n=18,241, 28.4%), middle school group (n=9,955, 15.5%), elementary school group (n=8,434, 13.2%), and no diploma group (n=2,035, 3.2%). The frequencies of the low and high EL groups were 31.8% (n=20,424) and 68.2% (n=43,705), respectively. Table 1 lists the clinicopathologic characteristics according to the education period and EL. The patients’ mean age decreased with increasing education period, and the proportion of patients with the following features was increased; age ≤ 50 years, tumor size ≤ 2 cm, negative lymph node, stage I, positive hormone receptor, negative HER2, low histologic grade. In addition, as the education period became longer, the proportion of patients who received lumpectomy, radiation therapy, and hormonal therapy increased. The same results were obtained from a comparison of the high and low EL groups, except for chemotherapy. The proportion of patients who received chemotherapy in the high and low EL groups was similar. Similar findings were observed in the subgroup aged ≤ 50 years and the subgroup aged > 50 years (S1 Table). In the subgroup aged ≤ 50 years, a higher proportion of patients in the low EL group received chemotherapy (p < 0.001), and in the subgroup aged > 50 years, there was no difference in the proportion of patients with respect to HER2 expression (p=0.218).
2. Survival analyses of all subjects
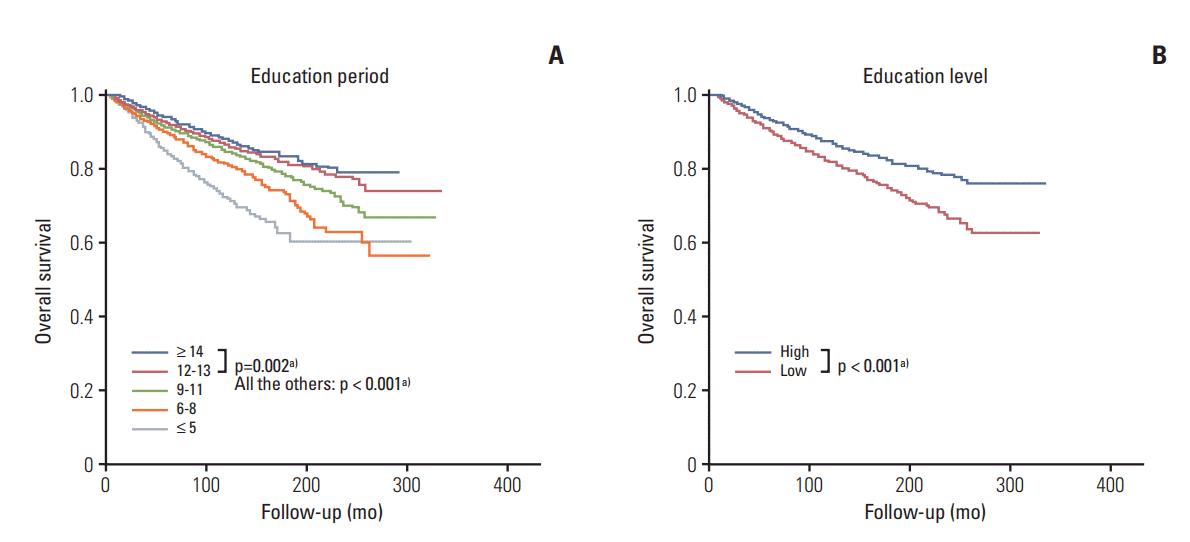
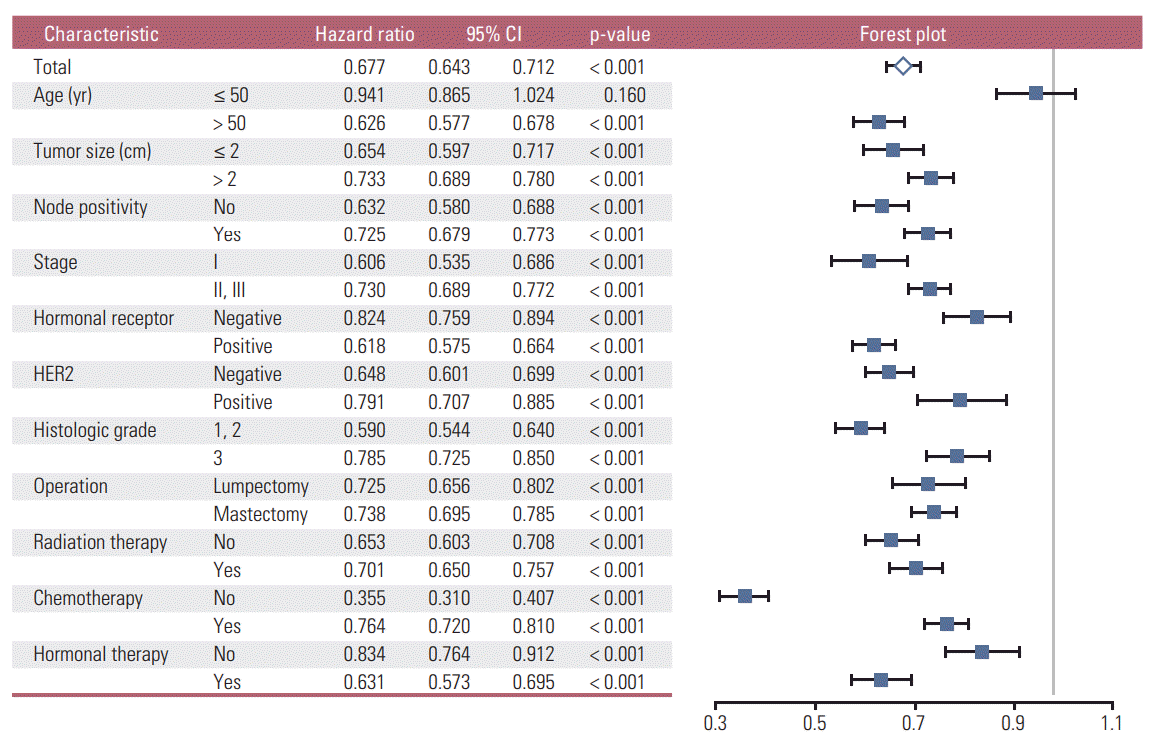
Survival analyses according to the education period revealed significant differences among all five education period groups, and a longer education period conferred a better prognosis (log-rank test, all p < 0.05) (Fig. 1A). Survival analyses according to the EL showed that the high EL group had a better prognosis than the low EL group (log-rank test, p < 0.001) (Fig. 1B). Subgroup analyses with a forest plot revealed the prognoses of the high EL group to be better than those of the low EL group in all subgroups, except for the age ≤ 50 years subgroup (Fig. 2). The lower HRs of the high EL group were more prominent in the subgroups with more favorable clinicopathologic features; tumor size ≤ 2 cm, negative lymph node, stage I, positive HR, negative HER2, and low histologic grade. With respect to the treatment modalities, a lower HR of the high EL group was most prominent in the subgroup without chemotherapy.
3. Survival analyses of the subgroup aged > 50 years and the subgroup aged ≤ 50 years
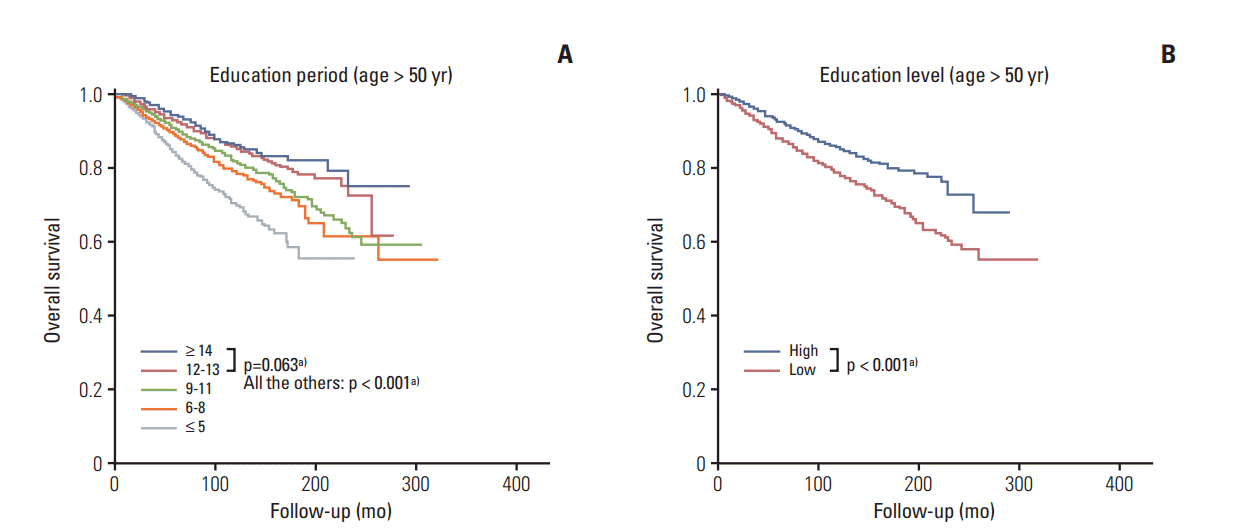
In the subgroup aged > 50 years, the high EL group showed superior survival than the low EL group both by the log-rank test (p < 0.001) (Fig. 3B) and by the Cox proportional hazards model (hazard ratio, 0.626; 95% CI, 0.577 to 0.678; p < 0.001) (Table 2, Fig. 2). A longer education period conferred a better prognosis than a shorter education period, except between the high school group and college group (all p < 0.001, except for p=0.063 between the high school group and the college group) (Fig. 3A). In the subgroup aged ≤ 50 years, no significant survival difference was observed between the high and low EL groups according to both the log-rank test (p=0.160; data not shown) and the Cox proportional hazards model (hazard ratio, 0.941; 95% CI, 0.865 to 1.024; p=0.160) (Fig. 2). In addition, there was no survival difference between each education period, except for between the elementary school group and college group (p=0.024, data not shown) and between the high school group and college group (p=0.020, data not shown). In the subgroup aged > 50 years, subgroup analyses showed that the high EL group had superior prognoses to the low EL group in all subgroups (S2 Fig.).
4. Univariate and multivariate analyses
For all subjects, univariate analyses showed that all of the following 15 factors were statistically significant: the EL (hazard ratio, 0.677; 95% CI, 0.643 to 0.712; p < 0.001), age, tumor size, node positivity, stage, HR, HER2, histologic grade, lymphovascular invasion, BMI, operation period, operation, radiation therapy, chemotherapy, and hormonal therapy (S3 Table). Multivariate analyses showed that the EL was a statistically significant independent factor in the biological model (hazard ratio, 0.869; 95% CI, 0.798 to 0.945; p < 0.001) and the treatment model (hazard ratio, 0.794; 95% CI, 0.743 to 0.849; p < 0.001), but not in the combined model (hazard ratio, 0.974; 95% CI, 0.878 to 1.082; p=0.625). Although HER2 lost its significance only in the biological model, the stage and BMI lost their significance in both the biological model and combined model.
In the subgroup aged > 50 years, the 14 factors mentioned above, except for age, were statistically significant in univariate analyses, and the EL was a significant independent prognosticator in all three models in multivariate analyses (Table 2): biological model (hazard ratio, 0.691; 95% CI, 0.615 to 0.778; p < 0.001), treatment model (hazard ratio, 0.723; 95% CI, 0.649 to 0.804; p < 0.001), combined model (hazard ratio, 0.821; 95% CI, 0.71 to 0.948; p=0.007).
5. Analysis of treatment modalities
For all subjects, a higher proportion of patients received lumpectomy, radiation therapy, and endocrine therapy in the high EL group compared to the low EL group (S4 Table). In subgroup analyses, these findings were consistent regardless of age, tumor size, node positivity, and HR. With respect to chemotherapy, although there was no significant differences between the high and low EL groups in all patient groups, a higher proportion of patients in the high EL group received chemotherapy in the pathologically unfavorable subgroups with a tumor size > 2 cm, positive node, and negative HR, in subgroup analyses. In the high EL group, a higher proportion of patients received lumpectomy in the subgroups with both a tumor size ≤ 2 cm and a tumor size > 2 cm. In the subgroup of lumpectomy, a higher proportion of patients received radiation therapy in the high EL group. In the subgroup with a positive hormone receptor, a higher proportion of patients received endocrine therapy in the high EL group. In the subgroup aged ≤ 50 years, a much higher proportion of patients received chemotherapy in the lower EL group compared to the subgroup aged > 50 years.
In the subgroup aged > 50 years, a higher proportion of patients in the high EL group received chemotherapy in the cases with unfavorable clinicopathologic features, such as tumor size > 2 cm and positive nodal metastasis compared to the low EL group (Table 3). The proportion of patients who received chemotherapy in the subgroup with a negative HR (p=0.084) and those who received radiation therapy in the subgroup with lumpectomy (p=0.164) was similar.
6. EL and the molecular subtypes of breast cancer
For all subjects, a high EL conferred better prognoses than a low EL in all molecular subtypes of breast cancer, including HR(+)/HER2(–) (p < 0.001), HR(+)/HER2(+) (p=0.003), HR(–) /HER2(+) (p=0.013), and HR(–)/HER2(–) (p=0.004) subtypes (S5 Fig.). The prognostic influence of EL was most significant in the HR(+)/HER2(–) subtype and least significant in the HR(–)/HER2(+) subtype. In the subgroup aged > 50 years, a high EL conferred a superior prognosis than a low EL across all molecular subtypes with the highest and lowest significance in the HR(+)/HER2(–) subtype (p < 0.001) and HR(+)/HER2(+) subtype (p=0.014), respectively (S6 Fig.).
Discussion
Although several papers have reported the prognostic role of EL in breast cancer, the results were not consistent and they are still controversial [1-11,13-17]. These inconsistent results regarding the prognostic role of the EL in breast cancer prompted this study, which found that the EL is a strong favorable prognostic factor for breast cancer; the high EL group showed a better prognosis than the low EL group (hazard ratio, 0.677; 95% CI, 0.643 to 0.712; p < 0.001) (S3 Table). Log-rank tests also showed that the high EL group had a superior prognosis than the low EL group (p < 0.001) (Fig. 1B) and that there were significant differences among all five education period groups and a longer education period conferred a better prognosis (all p < 0.05) (Fig. 1A). Multivariate analyses showed that the EL was an independent significant prognostic factor in the biological model (hazard ratio, 0.869; 95% CI, 0.798 to 0.945; p < 0.001) and the treatment model (hazard ratio, 0.794; 95% CI, 0.743 to 0.849; p < 0.001), but not in the combined model (hazard ratio, 0.974; 95% CI, 0.878 to 1.082; p=0.625) (S3 Table).
After confirming the prognostic role of the EL in unselected breast cancer patients, the prognostic influence of the EL was investigated further in each subgroup of breast cancer patients. Thus far, only a few papers have reported subgroup analyses of the EL in breast cancer. Albano et al. [3] reported that the breast cancer mortality rates were higher among women with less education than in those with more education (37.0 and 31.1 per 100,000, respectively, for black women, and 25.2 and 18.6 per 100,000, respectively, for white women). Kim et al. [10] reported that less than a high school education was associated with lower breast cancer mortality among white women (odds ratio [OR], 0.73; 95% CI, 0.6 to 0.9) but not among black women (OR, 1.1; 95% CI, 0.5 to 2.3). In this study, the EL was a strong independent favorable prognostic factor only in the subgroup aged > 50 years (log-rank test, p < 0.001) (Cox-proportional hazards model; hazard ratio, 0.626; 95% CI, 0.577 to 0.678) (Table 2, Figs. 2 and 3B), but not in the subgroup aged ≤ 50 years (Cox proportional hazards model, hazard ratio, 0.941; 95% CI, 0.865 to 1.024; Fig. 2) according to subgroup analysis. The prognoses of the high EL group were superior to those of the low EL group in all subgroups except for the subgroup aged ≤ 50 years, regardless of the following factors: tumor size, nodal positivity, stage, HR, HER2, histologic grade, operation, radiation therapy, chemotherapy, and hormonal therapy (Fig. 2). In the subgroup aged > 50 years, subgroup analysis showed that the high EL group had superior prognoses to the low EL group in all subgroups (S2 Fig.), and multivariate analysis showed that the EL was a significant independent prognosticator in all three models (Table 2):biological model (hazard ratio, 0.691; 95% CI, 0.615 to 0.778; p < 0.001), treatment model (hazard ratio, 0.723; 95% CI, 0.649 to 0.804; p < 0.001), combined model (hazard ratio, 0.821; 95% CI, 0.710 to 0.948; p=0.007). Dalton et al. [18] reported that women with higher education showed a reduced OR compared to women with a basic/high school education (OR, 0.83; 95% CI, 0.73 to 0.94) for high-risk breast cancer only in postmenopausal women, but they did not carry out survival analyses.
Although several papers have stated that the EL is a significant prognostic factor in breast cancer, the mechanisms through which EL plays the role of a prognostic factor are largely unknown. From the results of this study, an attempt was made to suggest several plausible explanations for these mechanisms in the following three aspects: biological aspect, treatment aspect, and aspects other than biological and treatment aspects.
First, in biological aspects, the high EL group showed more favorable biological features than the low EL group, which could partially explain the superior survival in the high EL group. As shown in Table 1, the mean age of the high EL group was lower and the proportion of patients aged ≤ 50 years was larger in the high EL group than in the low EL group. The proportion of patients with the following features was higher in the high EL group: age ≤ 50 years, tumor size ≤ 2 cm, negative lymph node, stage I, positive hormone receptor, negative HER2, and low histologic grade. In the subgroup aged > 50 years, similar findings to that mentioned above were obtained (S1 Table). These findings strongly suggest that a high EL is closely associated with favorable biological features leading to a superior prognosis. Several studies reported similar findings to the present results [13,18,19]. Rutqvist et al. [13] reported that the breast cancer stage was significantly higher among patients with a low level of education. Dalton et al. [18] reported that women with a higher education showed a reduced OR compared to women with basic/high school education only (OR, 0.88; 95% CI, 0.80 to 0.96) for high-risk breast cancer with size > 20 mm, lymph-node positive, high histologic grade, and hormone receptor negative. The diagnostic timing of primary breast cancer could play a key role in explaining the differences in the biological features according to the EL. In the high EL group, the early diagnosis of breast cancer could be the reason for the lower mean age at the first diagnosis and more favorable biological features, which might have resulted in better survival rates in the high EL group than the low EL group.
Second, in the treatment aspect, the patients in the high EL group were presumed to receive treatments more actively, which might have resulted in better survival rates. The proportion of patients who received lumpectomy, radiation therapy, and endocrine therapy was higher in the high EL group because the clinicopathologic features were more favorable in that group (Table 1), regardless of the tumor size, nodal positivity, stage, and HR status (S4 Table). Despite the favorable clinicopathologic features, the proportion of patients who received chemotherapy in the high EL group was not lower than that in the low EL group. In the subgroup aged > 50 years, the proportion of patients who received radiation therapy in the subgroup with a lumpectomy and who received endocrine therapy in the subgroup with a positive HR was higher in the high EL group. In addition, a higher proportion of patients in the high EL group received chemotherapy in the subgroups with more unfavorable clinicopathologic features, such as a larger tumor size, positive lymph node, and advanced stage (Table 3). These findings strongly suggest that an active attitude towards treatments in the high EL group could have contributed to the superior prognosis to that in the low EL group. Griggs et al. [20] reported that an EL less than high school was significantly associated with reduced doses of adjuvant chemotherapy (OR, 3.07; 95% CI, 1.57 to 5.99). Bouchardy et al. reported that patients form a low social class underwent breast-conserving surgery, hormonal therapy, and chemotherapy less frequently, particularly in the case of axillary lymph node involvement [21].
Third, there could be factors other than biological or treatment factors that are related to the effects of the EL on the survival rates of breast cancer patients. In the subgroup aged > 50 years, multivariate analyses showed that the EL was a significant independent factor in all three models (Table 2). In particular, in the combined model, the EL was still a significant factor after adjusting for biological and treatment factors. These findings suggest that there could be factors other than the biological or treatment factors that could have contributed to the superior survival in the high EL group. A range of factors were presumed to be included in this category: adherence to breast cancer screening [22], socioeconomic status [21,23-25], exercise [26], diet [26], smoking [27-29], etc.
Although this study showed that the EL was a strong prognostic factor in unselected breast cancer patients and in the subgroup aged > 50 years, the EL was not a prognosticator in the subgroup aged ≤ 50 years. Most importantly, as the low EL patients in the subgroup aged ≤ 50 years received adjuvant therapy more actively than those in the subgroup aged > 50 years, the survival difference could be reduced in the subgroup aged ≤ 50 years. Although the proportions of low EL patients who received chemotherapy and hormonal therapy in the subgroup aged > 50 years were 68.3% and 55.1%, respectively, those in the subgroup aged ≤ 50 years were 83.2% and 59.4%, respectively. Second, the prognostic effect of the EL could be weakened in the subgroup aged ≤ 50 years because the majority of the subjects in the subgroup aged ≤ 50 years were high EL patients, with the presumption that the EL is a strong prognostic factor in breast cancer. The proportion of high EL in the subgroup aged > 50 years and the subgroup aged ≤ 50 years was 27.7% and 72.3%, respectively. Third, as the overall survival rate was higher in the subgroup aged ≤ 50 years than in the subgroup aged > 50 years, the impact of the EL could be less prominent in the subgroup aged ≤ 50 years.
The influence of the EL on the molecular subtypes of breast cancer remains unknown, and no previous results on this issue could be found. This study examined the prognostic role of the EL in the molecular subtypes after classifying all breast cancers into four categories: HR(+)/HER2(–), HR(+)/HER2(+), HR(–)/HER2(+), and HR(–)/HER2(–) subtypes. In this study, the EL was a significant prognostic factor across all molecular subtypes of breast cancer, including the HR(+)/HER2(–), HR(+)/HER2(+), HR(–)/HER2(+), and HR(–)/HER2(–) subtypes for both the all subjects group and the subgroup aged > 50 years (log-rank tests, all p < 0.05) (S5 and S6 Figs.). The significance was highest in the HR(+)/HER2(–) subtype.
In this study, a large number of subjects (n=64,129) were analyzed using the nationwide breast cancer registry database from the Korean Breast Cancer Society. Although such a large number of subjects could provide considerable statistical power and reduce various biases, even in subgroup analyses, the present study had several limitations. The data were incomplete, particularly the data on adjuvant treatment modalities. The missing data rates were as follows: 1.8% for surgery, 13.1% for radiation therapy, 9.9% for chemotherapy, 33.2% for endocrine therapy. The impact of anti-HER2 therapy could not be analyzed due to insufficient data. Although an attempt was made to adjust for as many confounding factors as possible, most of the other confounding factors, such as socioeconomic status, smoking, drinking, exercise, etc., could not be analyzed due to insufficient data.
In conclusion, the EL is a strong independent favorable prognostic factor in breast cancer only in the subjects aged > 50 years, but not in the subjects aged ≤ 50 years. Favorable clinicopathologic features and active treatment could explain most of this observation. The EL was a significant prognostic factor in breast cancer regardless of the molecular subtype. The early detection of cancer and the receipt of appropriate treatments without omission are important for improving the overall survival for breast cancer patients aged more than 50 years with a low EL. Overall, the EL is one of the most important prognostic factors that should be considered carefully in a clinical setting.