Introduction
Gastric cancer is the fourth most common cancer worldwide, and the second leading cause of cancer-related deaths [1]. Lymph node (LN) metastasis of gastric cancer is one of the most important prognostic factors for staging, and the prediction of LN metastasis has also been an interesting issue in treatment of gastric cancer [2-5]. A previous study using genomic profiling suggested that discrimination between patients with a high risk of LN metastasis could be clinically helpful in selection of patients for extended LN dissection [6].
Translational research for genetic events in gastric cancer has been gradually expanded; however, most of these studies reported heterogeneous and inconsistent markers for prediction of LN metastasis [6-8]. Our previous study also reported that, in gastric cancer with LN metastasis, the combination of multiple biomarkers can be an independent prognostic indicator [9]. However, few studies on the direct analysis of differentially expressed genes (DEG) of LN metastasis in advanced gastric cancer (AGC) among different T stages have been reported. Theoretically, as the depth of tumor invasion (T stage) progresses, the risk of regional LN metastasis (N stage) usually increases. However, in the clinical field, there are certain types of AGC, such as tumors with advanced T stage and low N stage (even N0), or with relatively low T stage and extremely high N stage. Therefore we can hypothesize that by comparing those tumor samples with reciprocally different T and N stages, we may find specific candidate genes for LN metastasis of AGC. The purpose of this study is to use DNA microarrays to investigate DEG between AGC with far advanced T stage but without LN metastasis (highT and N0) and that with less advanced T stage but with extremely aggressive LN metastasis (lowT and highN).
Materials and Methods
1. Tissue preparation and clinical data acquisition
Gastric cancer tissue and the corresponding normal mucosa were obtained from five patients with primary gastric adenocarcinoma immediately following gastrectomy at Seoul National University Hospital. Those tissues were immediately frozen in liquid nitrogen and stored at –80°C. Patients were categorized as either having AGC with far advanced T stage but without LN metastasis (lowN, n=2) or with less advanced T stage with extremely high N stage (highN, n=3) according to the American Joint Committee on Cancer (AJCC) 7th TNM classification [2]. Tumor tissues for DNA microarray were validated by a pathologist using a portion of tumor cells (60%-90%) from each cancer tissue. Informed consent was obtained from all patients and ethical approval for this study was obtained from the Seoul National University Hospital Institutional Review Board (IRB No. 0802-023-233).
2. RNA preparation
Total RNA was isolated using Trizol (Molecular Research Center Inc., Cincinnati, OH). RNA concentration was estimated using a NanoDrop instrument (NanoDrop Technologies, Wilmington, DE) and electrophoresis was performed on each RNA sample to confirm the RNA quality. One microgram of total RNA was used for DNA synthesis using a SuperScript First Strand DNA Synthesis System (Life Technologies Inc., Rockville, MD) according to the manufacturer’s protocol.
3. Gene chip arrays
Affymetrix GeneChip Human gene 1.0 ST arrays (Affymetrix, Santa Clara, CA) were used for DNA microarray. Biotinylated mRNA was prepared according to the standard Affymetrix protocol using 100 ng of total RNA (Wt_sensetarget_label_manual (updated manual)_1, 2007, Affymetrix). Hybridization cocktails containing 5 to 5.5 μg of fragmented, end-labeled single-stranded DNA were prepared and hybridized for 17 hours at 45°C. GeneChips were washed and stained in the Affymetrix Fluidics Station 450. For validation, the GeneChips were scanned three times for each sample using the GeneChip Scanner 3000 7G. All gene array data were analyzed using Expression Console Software (Affymetrix). The Robust Multi-array Average (RMA; Irizarry, Hobbs, Collin, Beazer-Barclay, Antonellis, Scherf, and Speed 2003) algorithm was used for probe set (gene-level) intensity analysis and normalization. After RMA normalization, correlation between the tumor tissue and corresponding normal mucosa was confirmed using three samples from both highN (n=3) and lowN (n=2) patients (15 microarrays).
4. Gene selection and analysis
Differentially expressed genes were selected through a ≥ 2-fold change cut-off using Welch’s t test (p < 0.05). Volcano plot was used to identify DEG of five individual gastric cancer samples compared to the corresponding normal mucosa. The genes identified from the volcano plot were analyzed for evaluation of commonly expressed genes in each highN and/or lowN group. Gene annotation and selection for subsequent external validation was performed using Kyoto Encyclopedia of Genes and Genomics (KEGG), Pfam, PROSITE, gene ontology (GO), National Center for Biotechnology information (NCBI), and Universal Protein Resource (UniProt).
5. Validation
To determine whether these genes were similarly expressed in other gastric cancer tissues and normal gastric mucosa, reverse transcriptase–polymerase chain reaction (RT-PCR) was performed for external validation using five independent gastric cancer tissues with various N stages and the corresponding normal gastric mucosa. For RT-PCR, 1 μg of total RNA was used to generate single-stranded DNA using the SuperScript First Strand DNA Synthesis System (Life Technologies Inc.). A PCR reaction was performed for identification of gene expression. Thermocycling was performed in a final volume of 20 μL containing 1 μL DNA, 10 pmol of each primer, 2× SyBR green, 2× master mix, and carried out as follows: an initial denaturation at 95°C for 10 minutes, followed by 40 cycles of 94°C for 30 seconds, 57°C for 30 seconds, and 72°C for 30 seconds.
For larger scale validation, the collection of 450 independent gastric adenocarcinomas resected at Seoul National University Hospital in 2004 (SNUH-2004-GC; SuperBioChips Laboratories, Seoul, Korea) was used for tissue microarray (TMA). TMA was performed according to the following procedure. Core tissue biopsies (diameter, 2 mm) were obtained from individual paraffin-embedded gastric tumors (donor blocks) and arranged in new recipient paraffin blocks (tissue array blocks) using a trephine apparatus (Super-BioChips Laboratories). The tissue array blocks contained up to 60 cores of eight arrays, which allowed examination of 450 cases by immunohistochemistry (IHC). An adequate case was defined when the tumor occupied more than 10% of the core area. Each paraffin block contained internal controls, consisting of non-neoplastic gastric mucosa from the body, antrum, and intestinal metaplasia. IHC was performed using a Leica Bond-max automated immunostainer (Leica Microsystems, Newcastle upon Tyne, UK), according to the manufacturer’s protocols. After a tissue was sampled from each core, a staining pattern was scored as negative or positive. For statistical analysis, cellular staining was considered positive only when more than 10% of total cancer cells within one core were stained. Each TMA with immunohistochemical staining was assessed and scored without any clinical information.
Results
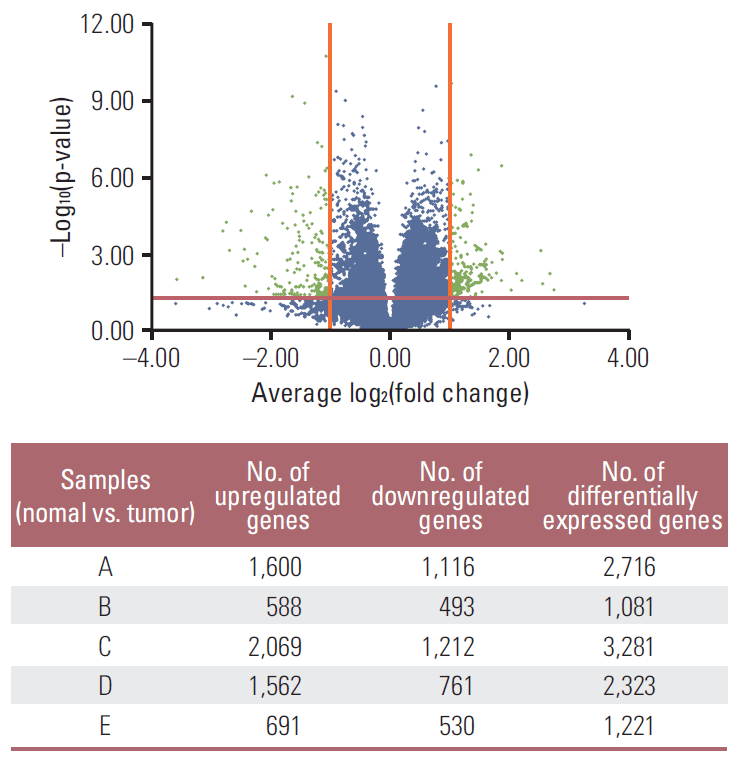
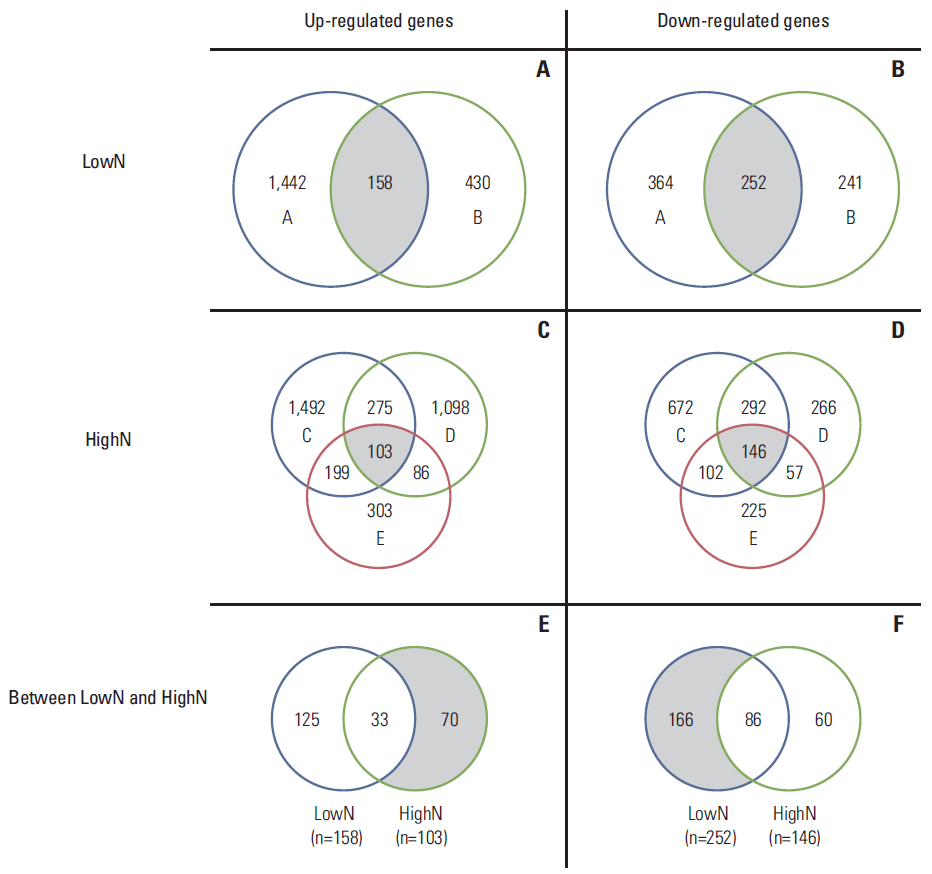
The demographics and clinical information of the patients are shown in Table 1. The highN group consisted of two patients with T4N0, and the lowN group consisted of three patients with T3N3. Except for patient B, all patients showed poorly differentiated tumors of diffuse type. Compared to normal gastric mucosa, we identified 1,081-3,281 DEG of each gastric cancer sample tissue using both t test and foldchange simultaneously. A volcano plot showed up- or down-regulated genes from each of the five gastric cancer samples (Fig. 1). Using DEG in each sample, a Venn diagram was created for evaluation of commonly up- or down-regulated genes in each lowN and/or highN group, respectively. As shown in Fig. 2, 252 genes were commonly down-regulated in the two samples of lowN (Fig. 2B), whereas 103 genes were commonly up-regulated in the three samples of highN (Fig. 2C). Among 103 up-regulated genes in highN, 70 genes were commonly up-regulated in highN but not in lowN (Fig. 2E). Among 252 down-regulated genes in lowN, 166 genes were commonly down-regulated in lowN but not in highN (Fig. 2F).
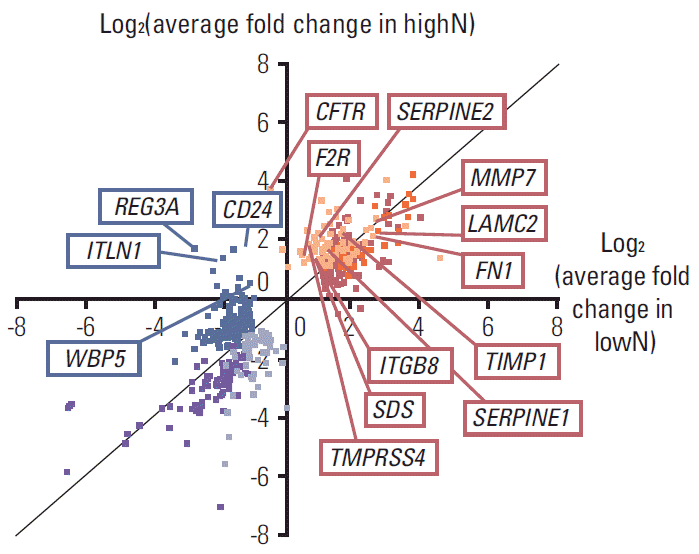
Among those DEG in each highN or lowN group, Fig. 3 shows average expression fold changes of 11 well-annotated genes, including CFTR, LAMC2, SERPINE2, F2R, MMP7, fibronectin 1 (FN1), TIMP1, SERPINE1 (PAI-1), ITGB8, SDS, and TMPRSS4, which were commonly up-regulated in highN but not in lowN, and four genes, including REG3A, CD24, ITLN1, and WBP5, which were commonly down-regulated in lowN but not in highN.
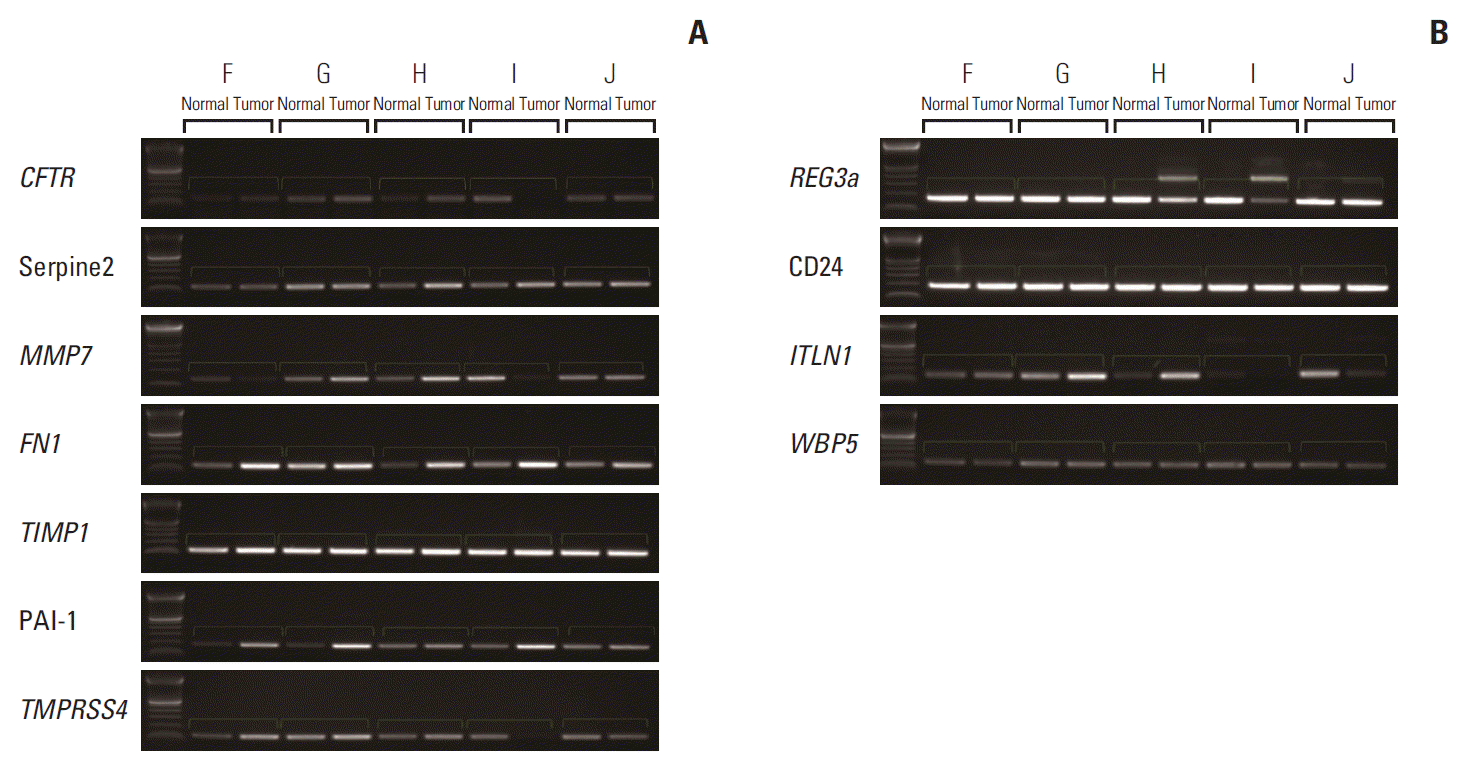
For external validation, RT-PCR was performed for hypothetical carcinogenesis-related genes, including CFTR, SERPINE2, MMP7, FN1, TIMP1, PAI-1, TMPRSS4, REG3A, CD24, ITLN1, and WBP5. Demographic and pathologic information of that validation group is shown in Table 2. Patient F, G, and I showed N3 stage similar to highN. Table 3 shows a primer list for RT-PCR. As shown in Fig. 4, compared to the corresponding normal mucosa, PAI-1 was overexpressed in tumor for sample F, G, and I (similar to highN), and similar expression between tumor and normal was observed in other samples with relatively lower LN stages. Other genes could not be validated for each sample.
Out of 450 samples in TMA, we identified 42 samples with T3N3 (the same as highN) and five samples with T4N0 (the same as lowN) which were followed up more than one year for consistent pathologic stage of each sample in TMA compared to that in initial DNA microarray and homogeneity of validated samples (Table 4). For IHC, mouse monoclonal anti PAI-1 antibody with 1:30 dilution (cat. No. NCL-PAI-1, Novocastra, Newcastle upon Tyne, UK) was used. TMA with immunohistochemical staining showed that 16.7 % (7/42) of T3N3 expressed PAI-1, but none (0/5) of T4N0 (p=0.393) (Fig. 5).
Discussion
In this study, we compared gene expression profiles between highN and lowN groups from five gastric adenocarcinoma tissues using GeneChip Human gene 1.0 ST arrays, and validated the results using RT-PCR and TMA.
The variation in gene microarray data is challenging, especially for cancer, because differences in expression measurements can be caused by biologic differences, or by technical variations [10,11]. To overcome these variations, we employed technical replicates, meaning that the same biological samples were tested and analyzed across multiple arrays in triplicate microarray experiments, and also biological replicates, meaning that multiple independent samples were obtained in the same biological conditions not only for microarray but also for external validation [10].
A volcano plot is a scatter-plot using fold-change and t test criteria, which has been used in analysis of mRNA expression levels from microarray data [12,13]. A previous study reported that small effects detected by a volcano plot, which may be excluded from other methods, could have low variance with high significance, whereas the large effects for some genes can be artifacts of high variance [12]. In this study, we selected genes using two selection criteria simultaneously (both upper left and upper right of the plot) above a horizontal line which presents the chosen significance as well as outside a vertical line which represents a threshold of difference [14]. However, a straightforward comparison using fold change and t test may have systematic errors from the experimental methods that can cause changes in data distribution and make any statistical inference unreliable. Ranking genes by fold change and t test does not correlate with the order of a previously generated list of DEG [13]. To overcome this limitation, we performed external validation for our results from volcano plot analysis. In the current study, from volcano plot analysis with external validation (RT-PCR and TMA) we found that PAI-1 could be a candidate gene for aggressive LN metastasis in AGC. The urokinase plasminogen activator (uPA) system is a serine protease family comprised of uPA, plasminogen activator inhibitors, tissue type plasminogen activator, and uPA receptor (uPAR). The uPA system is associated with degradation and regeneration of the basement membrane or extracellular matrix, and may play an important role in cell adhesion, migration, tumor cell invasion, and possible metastasis [14,15]. PAI-1, a major controller of the uPA/uPAR system, may positively influence tumor invasion, angiogenesis and represent an unfavorable prognostic factor by providing traction for cells with high uPA activity or removing the adhesion signal from uPA/uPAR binding [16,17]. For gastric cancer, previous studies have reported that PAI-1 expression may serve as an independent prognostic marker of primary gastric cancer, and expression of the uPA system including PAI-1 shows positive correlation with peritoneal metastasis of gastric cancer [18-20]. In addition, research on a targeted therapy using PAI-1 RNAi in an in vivo mouse model for gastric cancer metastasis was recently reported [21]. These studies showed that PAI-1 RNAi in vivo effectively reduced gastric peritoneal metastasis and decreased tumor progression. However, those studies focused on a single target gene, PAI-1, and its related uPA system from the beginning, without any comparative analysis with other genes. Our study showed that, among several DEGs from a DNA microarray analysis between highN and lowN groups, after validation, only PAI-1 showed significant association with aggressive LN metastasis of AGC. Based on this result, we can assume that previously reported poor prognosis of gastric cancer patients with overexpression of PAI-1 might have resulted from aggressive LN metastasis. Interestingly, a recent study of prostate cancer found specific relationship between CFTR and uPA through miR-193b in prostate cancer development [22]. Research on CFTR in gastric cancer has been limited, and it remains unclear whether CFTR represents a marker of the metaplastic process or it directly contributes to progression of disease in gastric cancer [23]. Based on our DNA microarray results, there might be tentative involvement of both PAI-1 and CFTR for LN metastasis in gastric cancer, even though the expression of CFTR was not validated. Further research on the role of PAI-1 and CFTR in gastric cancer metastasis would be promising.
The main limitation of this study is small sample size, and, consequently, multiple correction test for selection of DEGs was difficult to apply. That tentative multiple comparisons error may cause discrepancy between microarray data and RT-PCR which could be false positive of microarray results. Therefore, in order to reduce type I error, we applied fold change of gene expression and t test simultaneously for microarray data, and also validated those selected DEGs using independent samples with various stages. As a result, at least PAI-1 was consistent with our hypothesis. For larger scale validation, TMA comprising independent samples with typical highN or lowN groups (T4N0 or T3N3) was also performed, even though that number of samples was still not enough for statistical significance. Considering the reference data for the 7th AJCC TNM classification from 1986 to 2006, the proportion of T3N3b was only 1.9% and that for T4N0 was 4.1% [24]. As a single institution study, it is limited to obtain those “rare samples” enough for more significant validation with informed consent of every patient. Instead, this study can suggest the scientific implication for the role of PAI-1 in AGC, and promote multi-institutional validation with standard operating protocols in the future.