Introduction
Although cells are routinely used for prenatal diagnosis of a wide range of foetal abnormalities caused by genetic defects, cell types present in human amniotic fluid (HAF) have not been thoroughly characterized. HAF obtained during amniocentesis includes a variety of stem cells originating from embryonic and extra-embryonic tissues (1), and cells of different embryonic/fetal origins of all three germ layers have been reported to exist in amniotic fluid (2). HAF has also been shown to contain cells expressing Oct-4 antigen, a specific marker of pluripotent stem cells (3), and these cells display multilineage differentiation potential; depending on the specific culture conditions, they can differentiate into adipocytes, osteocytes or neuronal cells (4). Thus, HAF is a possible source of pluripotent stem cells for cell-based therapeutics, a strategy that will not raise ethical concerns associated with use of embryonic stem cells (ESCs).
Cellular senescence might also contribute to a decline in tissue homeostasis by exhausting the supply of progenitor cells or stem cells due to irreversible growth arrest. The regulation of stem cell senescence has potential importance in different therapeutic strategies: one is cell therapy; the other is inhibition of expansion of the cancer stem cell population. For cell therapies such as cell transplantation in regenerative medicine, stem cell senescence must be prevented in order to acquire enough cells to achieve differentiation into specialized cell types. Conversely, for cancer therapy, stem cell senescence must be induced to prevent the proliferation and differentiation of transformed cancer stem cells.
Cellular senescence is usually accompanied by changes in gene expression. Normal mouse embryonic fibroblasts (MEFs) reach replicative senescence after seven passages in culture, whereas MEFs from Bmi-1-/- mice show a premature-senescence phenotype at the third passage (5), indicating the important role of Bmi-1 as a repressor of senescence. In flies, expression of a dominant-negative p53 extends life-span (6). Conversely, mice with activated p53 display signs of premature aging (7). Also, p21 (Waf1/Cip1/Sdi1), a downstream target of p53, is a powerful broad spectrum cyclin-dependent kinase (CDK) inhibitor that blocks the activity of cyclin-CDK2 and cyclin-CDK4/6 complexes that are required for cell cycle progression. An increase in p21 is a central feature of senescence (8). The other major effector of cell cycle arrest in human senescent cells is p16 (Ink4a). p16 inhibits cyclin D1-CDK4/6, which is the kinase complex responsible for pRb phosphorylation. p16 siRNA knockdown studies indicate that p16 is needed to maintain senescence in human fibroblasts (9).
In the current study, we examined gene expression profiles of HAF cells during senescence to identify new cellular senescence-associated genes, genes that might serve as targets for cancer therapy or cell therapy.
Materials and Methods
1. Human amniotic fluid (HAF) cell isolation and culture
HAF samples (5 mL each) were obtained from patients undergoing amniocentesis for routine prenatal diagnosis at 14~16 weeks of pregnancy. Cells were isolated from HAF no more than 12 h prior to use in experiments. HAF samples were centrifuged at 300×g for 15 min, and the resulting pellets were washed twice with low-glucose Dulbecco's modified Eagle's medium (DMEM) (Invitrogen, Carlsbad, CA) to remove blood and cell debris. All cells isolated from the 5 mL sample were plated in a 35 cm2 culture flask (Nunc, Rochester, MN) containing DMEM supplemented with 100 U/mL penicillin, 0.1 mg/mL streptomycin (Invitrogen), 3.7 mg/mL sodium bicarbonate, 10 ng/mL epidermal growth factor (EGF) (Peprotech, Princeton, NJ) and 10% foetal bovine serum (FBS) (Invitrogen). Seven days after the initiation of the culture, the medium was replaced with fresh medium, and subsequently was replaced twice a week. When the cells reached confluence, they were treated with 0.125% trypsin and 1 mM ethylenediamine tetraacetic acid (EDTA) for 3 min. The released cells were collected and replated for subculture. These HAF-derived fibroblastoid-type cells were maintained in a humidified atmosphere in an incubator under 5% CO2 at 37℃.
2. RNA Isolation and Amplification for illumina microarray
Total RNA was extracted using Trizol® (Invitrogen) according to the manufacturer's protocol. After DNase digestion and clean-up procedures, RNA samples were quantified, aliquoted and stored at -80℃ until use. For quality control, RNA purity and integrity were evaluated by denaturing gel electrophoresis, OD 260/280 ratio, and analysis on an Agilent 2100 Bioanalyzer (Agilent Technologies, Palo Alto, CA).
Total RNA was amplified and purified using Ambion Illumina® RNA amplification kits (Ambion, Austin, TX) to yield biotinylated cRNA according to the manufacturer's instructions. Briefly, 550 ng of total RNA was reverse-transcribed to cDNA using a T7 oligo (dT) primer. Second-strand cDNA was synthesized, in vitro transcribed, and labeled with biotin-NTP. After purification, the cRNA was quantified using an ND-1000 Spectrophotometer (NanoDrop, Wilmington, DE).
3. Illumina microarray
The labeled cRNA samples were hybridized to a custom Illumina Sentrix Array Matrix (SAM; Illumina Inc., San Diego, CA) for 16~18 h at 55℃, following the manufacturer's instructions. The SAM contains 96 identical oligonucleotide arrays, consisting of 710 genes, 698 user-selected and housekeeping genes, and 12 negative control sequences. There were two 50-mer probes representing each gene. The SAM was washed, blocked with casein in phosphate buffered saline (PBS), incubated with streptavidin-Cy3, dried, and scanned on an Illumina® BeadArray Reader GX.
4. Reverse transcription and quantitative real-time PCR
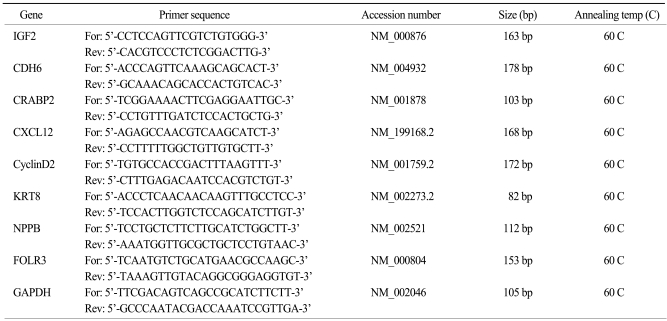
Total RNA was reverse transcribed in a final volume of 20 µL using 1 µg of total RNA, 1 µL oligo-dT primers, and 25 mM dNTP. After samples were heated for 5 min at 65 C, 4 µL of 5× First-strand buffer, 1 µL dithiothreitol, and 1 µL of Superscript II RNase H-reverse transcriptase (Invitrogen) were added. Reverse transcription was performed at 37℃ for 50 min. The cDNA was stored at -20℃. Quantitative real-time PCR (qPCR) was performed using the primers shown in Table 1. qPCR was done using an Mx3000P (Stratagene, Austin, TX) using the SYBR Premix Ex Taq (Perfect Real Time) master mixture (Takara, Japan). Each reaction mixture contained 2 µL of template cDNA, a final concentration of 0.2 µM of forward and reverse primers, 10 µL of 2× SYBR Premix Ex Taq, 0.4 µL of 50× ROX Dye II, and RNase-free dH2O to make a final volume of 20 µL. PCR for each gene consisted of the following sequence: 95℃, 10 sec for initial denaturation, and 40 cycles of 95℃ for 5 sec and 60℃ for 20 sec. To determine primer specificity, three stages (95℃ for 15 s, 60℃ for 20 s, and 95℃ for 15 s, with a ramping time of 20 min) were added at the end of the PCR to obtain dissociation curves for each gene. qPCR data were analyzed by MxPro™ software (Stratagene). Relative transcript levels were determined using the 2-ΔΔCt method and normalized to GAPDH.
Results
1. Senescence of stem cells derived from human amniotic fluid (HAF)
HAF stem cells were cultured as previously described (10). Average doubling time was approximately 3.6 days. By the 10th passage they stopped proliferating at which time their morphology was flat and large, which is one of the characteristics of cellular senescence after about 10 passages. This is distinct from the morphology of early-staged HAF stem cells (Fig. 1A). Consistent with the morphological changes, the cumulative cell number was not increased after 11 passages (Fig. 1B).
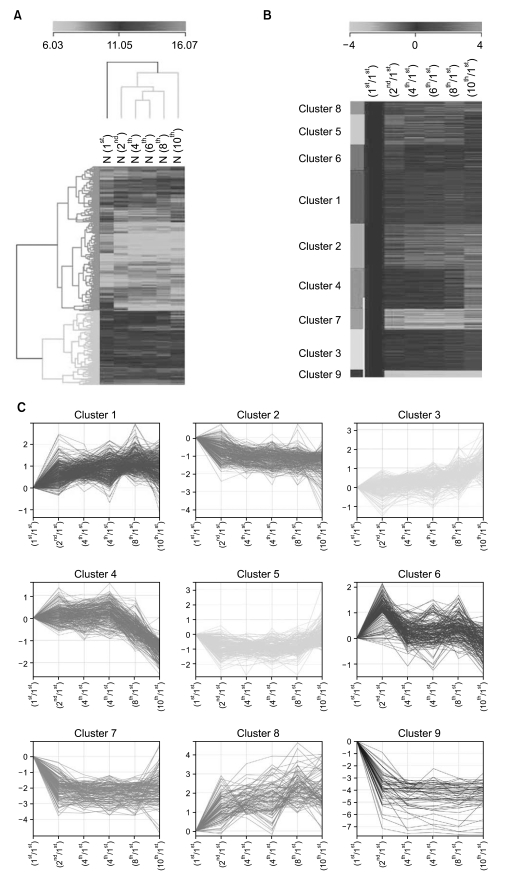
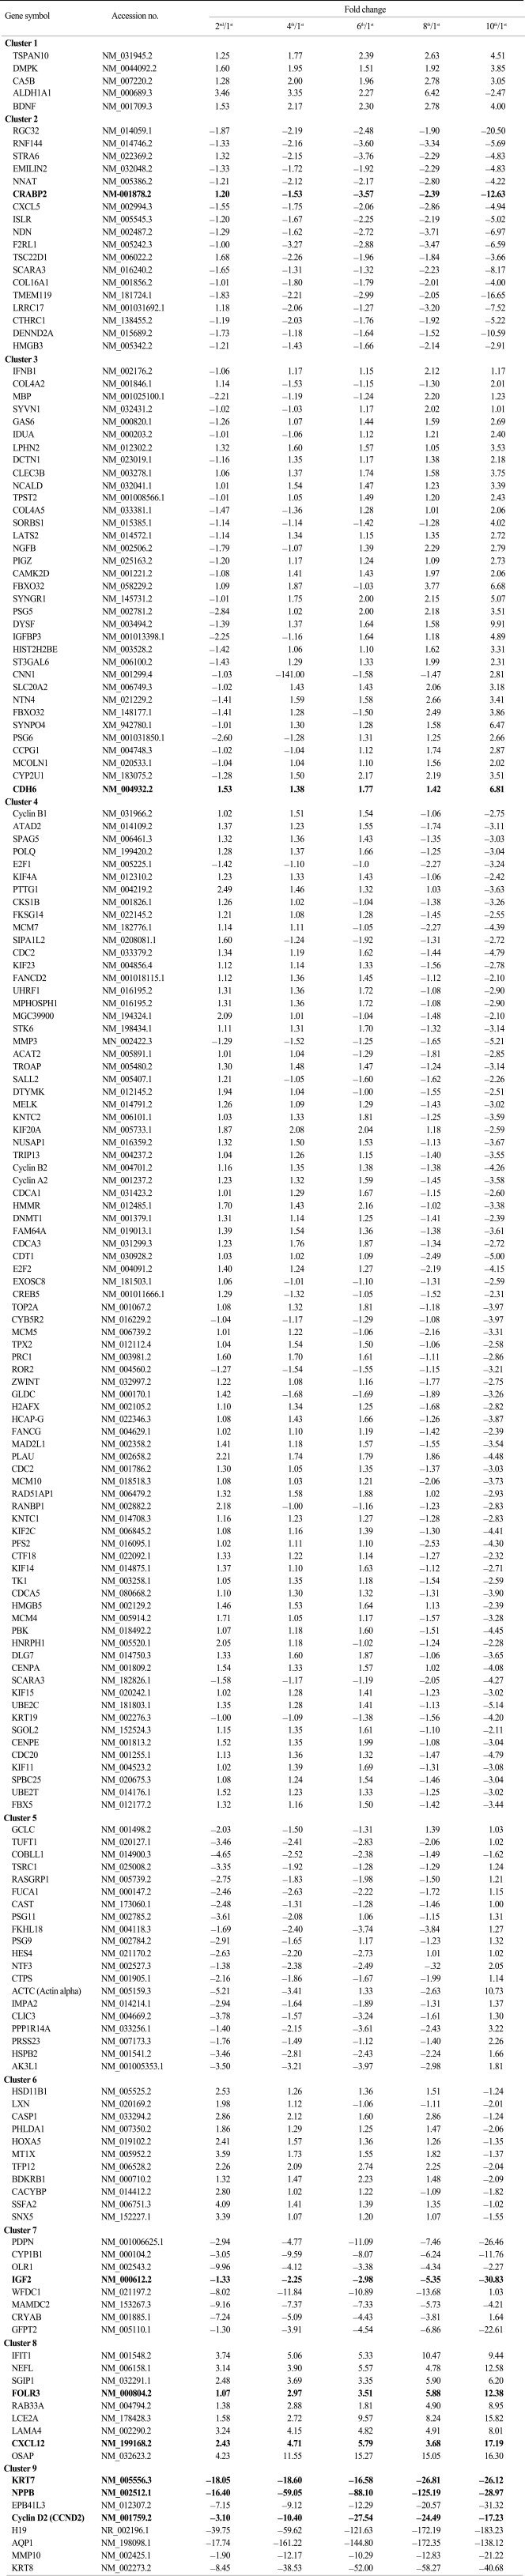
2. Gene expression profile of HAF stem cells according to passage numbers
To identify cellular senescence-associated genes, we performed illumina microarray chip assays using HAF stem cells at each passage (1st, 2nd, 4th, 6th, 8th, and 10th). Differentially expressed genes were grouped according to their expression profiles along the time course (Fig. 2). Of the 25,804 genes on the chip, 1970 showed an over 2-fold change relative to control (1st passage). Each of the 1970 genes was assigned to one of 9 distinct temporal expression clusters (Fig. 2B and C). Each cluster included genes showing expression profiles similar to each other, but distinct from genes in other clusters. In this analysis, a variety of expression patterns were identified, including ones that depicted gradually increasing expression levels (cluster 1, 3, and 5), and others that depicted early peaks of expression followed by decreasing expression levels (cluster 2, 4, 6, and 9) (Fig. 2C). Table 2 shows lists of gradually changed genes assigned to each cluster.
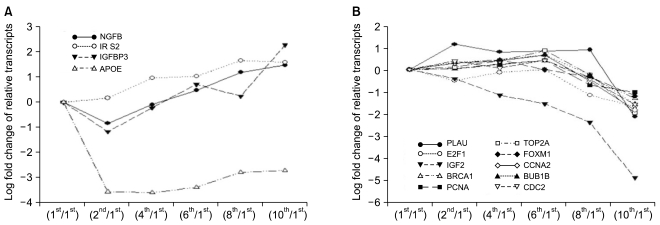
3. Expression patterns of aging-related genes during the process of senescence of HAF cells
To see the expression pattern of known aging-related genes such as p53, pRb, Bmi-1 during senescence of HAF cells, we analyzed chip data. Thirty eight aging-related genes were included among the 1,970 genes that showed over a 2-fold change relative to control. Contrary to our expectations, expression patterns of aging-related genes over time (i.e., over several passages) were mostly irregular although there were, rarely, big fold changes (data not shown). Among 38 genes, we selected ones with gradually increasing or decreasing expression patterns (Fig. 3). Upregulated genes included nerve growth factor beta (NGFB), insulin receptor substrate 2 (IRS2), insulin-like growth factor binding protein 3 (IGFBP3), and apolipoprotein E (APOE). Expression of ten genes, including PLAU, E2F1, IGF2, BRCA1, TOP2A, PCNA, FOXM1, CCNA2, BUB1B, and CDC2, was gradually downregulated. In particular, IGF2 was drastically downregulated by the 10th passage.
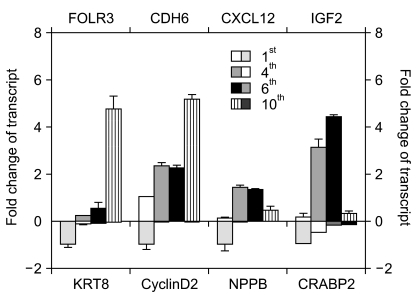
4. Verification of the illumina chip data
To verify the illumina chip data, we selected several genes in Table 2 and examined their expression levels by quantitative real-time PCR (RT-qPCR) (Fig. 4). We selected eight genes (three upregulated genes and five downregulated genes) that were gradually and dramatically changed as a function of their passage number. These were receptors, signaling molecules, or cytoskeletal proteins. While folate receptor 3 (FOLR3), cadherin 6 (CDH6), and chemokine (C-X-C motif) ligand 12 (CXCL12) were upregulated, natriuretic peptide precursor B (NPPB), cyclin D2, insulin-like growth factor 2 (IGF2), keratin 8 (KRT8), and cellular retinoic acid binding protein 2 (CRABP2) were downregulated according to the chip data (Table 2). To confirm the chip data, RT-qPCR was performed. The expression pattern for both FOLR3 and CDH6 were gradually increased with passage number, consistent with the chip data. CXCL12 showed a drastic increase at the 4th passage and then decrease at the 10th passage even though the expression level was higher than that at the 1st passage. This was inconsistent with the chip data. Expression patterns of KTR8, NPPB, and CRABP2 were consistent with those of the chip data. However, the expression pattern of the IGF2 gene was different from the chip data. While IGF2 mRNA expression had decreased slightly by the 8th passage and then abruptly dropped in the chip data, RT-qPCR results indicated that gene expression had increased until the 6th passage and then was drastically downregulated. Very interestingly, a much more abrupt decrease in NPPB mRNA expression was shown by RT-qPCR than by the chip data.
Discussion
Cellular senescence is considered to be one of the safeguard mechanisms against development of cancers. Therefore, an understanding of the genes controlling stem cell senescence may provide (i) relevant information on the mechanisms underlying malignant transformation of stem cells and (ii) therapeutic targets for novel anti-cancer agents. In this report, we did illumina microarray chip assays on HAF stem cells to find new senescence-related genes. We selected eight genes that had gradually and dramatically changed expression patterns and confirmed changes in expression levels by RT-qPCR. Our results strongly suggest that FOLR3 and NPPB are potent regulators that induce or suppress, stem cell senescence.
Environmental and hyperproliferative stressors can be potent inducers of senescence. The main two pathways involved in stress-induced senescence are p19-p53 and p16-Rb (11). Recently, it has been shown that the Bmi-1 oncogene functions as an inhibitor of senescence, while the overexpression of Bmi-1 extends the replicative lifespan. Bmi-1-null fibroblasts enter premature senescence through the p16-Rb pathway by p16 up-regulation (12). Also, it has been reported that Bmi-1 functions in vivo to maintain the pool of neuronal and hematopoietic stem cells by inhibiting their senescence program through the repression of p16 expression (13). Contrary to expectations, our chip data did not show any changes in the mRNA expression of these main senescence-regulated genes. However, this might be explained by the fact that since posttranslational protein modifications including phosphorylation, acetylation, and ubiqitination play important roles in both the activation and function of p53 and pRb (14), all mRNA level changes in these molecules cannot represent changes in their functions as transcriptional repressors inducing stem cell senescence. Alternatively, apart from the function of p53 and pRb, a senescence-associated cell cycle arrest can be induced by the downstream regulators of p53 and pRb such as a reduction in total E2F/DP activity (15). In addition, the downregulation of selected positive-acting cell cycle regulatory genes can also induce stem cell senescence, including the c-fos proto-oncogene, genes for Cdc2 and cyclin A and E, components of cyclin-dependent protein kinases (Cdks), genes for Id1 and Id2 inhibitors of basic helix-loop-helix transcription factors, and the multifunctional transcription factor E2F1 (16). Consistent with these previous results, our chip data also showed that gene expression of E2F1, cyclin A2 (CCNA2), and CDC2 were significantly downregulated at the latter passage numbers (8th and 10th passages) (Table 3) although we didn't verify the expression pattern of these genes by RT-PCR or RT-qPCR in this study.
Here we selected eight genes including FOLR3, CDH6, CXCL12, NPPB, cyclin D2, IGF2, KRT8, and CRABP2, for verifying results from the chip data because these genes showed gradual and drastic changes in expression patterns. It has not been reported to date that these selected genes are directly related to cellular senescence. Although an interest in IGF2 derives mostly from its connection with IGF1 and how the IGF1/GH axis appears to regulate aging in model organisms, IGF2's role in aging is unproven (17). Recently, it was reported that overall IGF2 expression increased during senescence of human prostate epithelial cells due to the loss of IGF2 imprinting (18). However, our RT-qPCR result, which did not match our chip data, showed that IGF2 mRNA levels were increased by the 6th passage and then abruptly dropped by the 10th passage (Fig. 4). The discrepancy between our result and theirs might be caused by our using different cell types. Or, IGF2 might not be a main regulator of cellular senescence. The cellular retinoic acid binding proteins (CRABPs) are cytoplasmic receptor proteins for retinoic acid, which has been used as a therapeutic drug since it induces the senescence of tumor cells (19). These proteins play a role in the binding, transport, and metabolism of retinoic acid. Growth inhibition and apoptosis in retinoid-treated MCF-7 cells have been previously associated with the retinoid-binding protein CRABP2 (20). Although HAF stem cells were not treated with retinoids in this study, we also found that CRABP2 was strongly downregulated with increases in passage number (Fig. 4). These results suggest that CRABP2 might potentially act as a negative regulatory mechanism that limits cellular senescence. Unexpectedly, mRNA levels of both NPPB and FOLR3 were dramatically downregulated and upregulated, respectively, in both our chip data and in our qRT-PCR. Although it has been reported that the level of NPPB is particularly important in heart disease, since increased levels of this peptide in the circulation is a clinical indicator of the severity of hypertrophy (21), there has not yet been a published study about the role of NPPB in cellular senescence. Folate metabolism and its receptors have been reported to be related to cancer development, especially, cancers that originate from epithelial cells (22). Animal experiments suggest that proper supplementation with folate can reduce carcinogenesis, whereas excessive supplementation may increase tumor growth (23). These opposing effects are thought to be attributable to an essential requirement for folate in the synthesis of DNA precursors needed to support rapidly proliferating tissues. Tumor cells frequently upregulate folate receptors (FOLR) to satisfy their elevated need for nucleotides to support DNA synthesis and growth (24). Furthermore, the high affinity of FOLRs, especially, FOLR1, for folate and its selective overexpression in tumors provides an opportunity for tumor-specific chemotherapy and radiopharmaceutical delivery, e.g., folic acid analogues and conjugates, such as 5,10-dideazatetrahydrofolic acid, which are directly cytotoxic and therapeutically effective against some types of tumors. However, FOLR3 has not yet been reported to play an important role in cancer development and cellular senescence. Taken together, changed expression levels of NPPB and FOLR3 might be good markers for cellular senescence.
Conclusion
Future studies should be aimed at revealing whether NPPB or FOLR3 are directly involved in stem cell senescence and how they are regulated in response to replicative and stress-induced signals that cause stem cell senescence. Discovering the regulatory mechanisms of these genes should make it possible to design new therapeutic approaches to improving the efficacy and to decreasing the side effects of cancer therapy that target differentiated tumor cells as well as non-differentiated tumor stem cells.