Introduction
Since 1983, as the leading cause of death [1], cancer has become a major public health concern in Korea. Annually, over 190,000 patients are newly diagnosed with cancer in Korea, and one out of four deaths is due to cancer [2,3]. Although the cancer registration system in Korea is very efficient and can provide nationwide cancer statistics within a relatively short time, at least a 2-year lag is still required for accurate data collection and compilation. To plan and apply a cancer control program, it is important to assess the number of new cases and deaths that are expected to occur during the current year. In this report, we provide the projected cancer incidence and mortality ratio based on the data up to 2009.
Materials and Methods
The Korean Ministry of Health and Welfare initiated a nationwide, hospital-based cancer registry (the Korea Central Cancer Registry [KCCR]) in 1980. The details of the history, objectives, and activities of the KCCR have been documented elsewhere [4]. Incidence data from 1999 to 2009 were obtained from the Korea National Cancer Incidence Database (KNCI DB). Cancer cases were classified according to the International Classification of Diseases for Oncology, 3rd edition [5] and converted according to the International Classification of Diseases, 10th edition (ICD-10) [6].
Mortality data from 1993 to 2010 were obtained from Statistics Korea [1]. The cause of death was coded and classified according to ICD-10.
The cancer sites included in this report are (i) all cancers combined and (ii) the 22 most common cancers: lip, month, and pharynx (C00-C14), esophagus (C15), stomach (C16), colon and rectum (C18-C20), liver and intrahepatic bile duct (liver) (C22), gallbladder and other parts of biliary tract (gallbladder) (C23-C24), pancreas (C25), lung and bronchus (lung) (C33-C34), breast (C50), uterine cervix (C53), uterine corpus (C54), ovary (C56), prostate (C61), testis (C62), kidney (C64), bladder (C67), brain and central nervous system (C70-C72), thyroid (C73), Hodgkin lymphoma (C81), non-Hodgkin lymphoma (C82-C85, C96), multiple myeloma (C90), leukemia (C91-C95), and all others.
Population data were obtained from the resident registration population reported by Statistics Korea. The mid-year population on July 1 of the respective year was applied when computing the incidence and deaths.
Due to the time required for data collection and analysis, incidence and mortality data are available is usually 2-3 years behind the current year. As such, we projected the expected number of new cancer cases and deaths in Korea in the current year to provide an estimate of the current cancer burden.
Linear regression models [7] were used to assess the time trend and the projection of rates. Based on the observed cancer incidence data, a linear regression model was fitted to the age-specific rates by 5-year age group against observed years. From the projected age-specific rates in 2012, the estimated number of cancer cases was calculated by multiplying the rates by 2012's projected age-specific population size. For thyroid and prostate cancer, which showed significant curvilinear trends, we used a square root transformation when fitting a linear regression model and converted the predicted values back to the original scale.
To estimate the number of cancer deaths in 2012, we first ran a Joinpoint regression model on the data for 1993-2010 to detect the year of significant changes in the trend of cancer mortality by sex and cancer site. A Joinpoint regression describes changes in data trends by connecting several different line segments on a log scale at "joinpoints." This analysis was performed using the Joinpoint software (version 3.3, http://srab.cancer.gov/joinpoint) from the Surveillance Research Program of the National Cancer Institute in the USA [8]. After identifying the year of significant trend changes using Joinpoint regression analysis, a simple linear regression model was fitted to the last line segment to estimate age-specific cancer mortality rates in 2012. Similar to the method used for the projection of cancer incidence, the number of new deaths was then projected by multiplying the age-specific cancer mortality rates by 2012's projected age-specific population.
We summarized the results using the crude rates (CRs) and age-standardized rates (ASRs) of cancer incidence and mortality. The ASRs were standardized using the World Health Organization (WHO) world standard population [9].
Results
1. Incidence
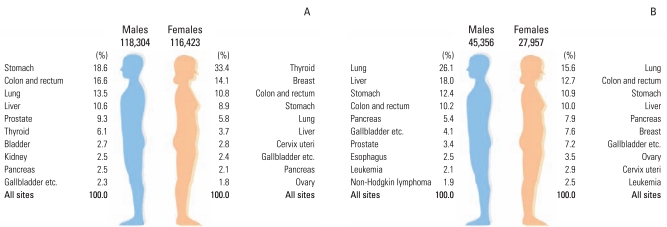
Table 1 presents the estimated number of new cancer cases and deaths during 2012 in Korea by sex and cancer site. It is projected that 234,727 cases of cancer incidence will occur in 2012.
Table 2 presents the estimated CRs and ASRs of cancer incidence in 2012 by sex and cancer site. The CRs of all sites combined in males and females respectively in 2012 are projected to be 465.6 and 459.7 per 100,000, and the ASRs of all sites combined are projected to be 345.1 and 300.9 per 100,000. In males, the five leading primary sites of cancer are expected to be the stomach (CR, 86.8; ASR, 63.2), colon and rectum (CR, 77.4; ASR, 56.7), lung (CR, 62.9; ASR, 46.6), liver (CR, 49.5; ASR, 35.6), and prostate (CR, 43.4; ASR, 32.5), accounting for 68.7% of all newly diagnosed cancers in 2012. In females, the most common cancer sites are expected to be thyroid (CR, 153.4; ASR, 109.4), breast (CR, 64.6; ASR, 44.1), colon and rectum (CR, 49.5; ASR, 29.5), stomach (CR, 41.1; ASR, 24.7), lung (CR, 26.6; ASR, 14.7), and liver (CR, 17.1; ASR, 10.0), accounting for 76.7% of all newly diagnosed cancers (Fig. 1). Thyroid cancer alone is projected to account for 33.4% (38,863 cases) of incident cases in females in 2012.
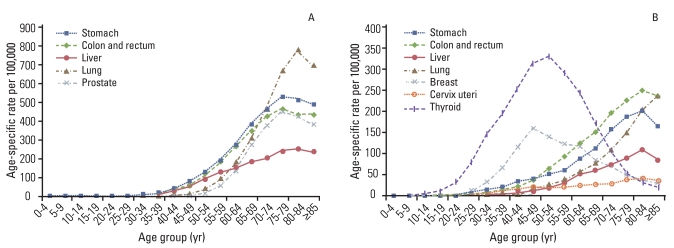
Table 3 presents the most common cancer sites expected in 2012 by sex and age group. Leukemia and thyroid cancer are projected to be the most common forms of cancer in both sexes for the 0-14 and 15-34 age groups. Gastric cancer is predicted to be the most common cancer in males 35-64 years of age, whereas lung cancer is predicted to be more frequent for malese ≥65 years of age. Thyroid cancer is predicted to be the most common cancer for females 35-64 years of age, whereas colorectal cancer is predicted to be the most common cancer for females ≥65 years of age. Fig. 2 shows the age-specific incidence rates of the selected cancers for men and women in 2012. The projection indicates that the incidence of gastric, lung, liver, and colorectal cancers will increase gradually with age. In women, the age-specific incidence rates of breast and thyroid cancer will increase with age until the 5th and 6th decades of life, and then level off.
2. Mortality
It is estimated that 73,313 cancer deaths will occur in Korea during 2012 (Table 1). The CRs of all sites combined in 2012 respectively for males and females are projected to be 178.5 and 110.4 per 100,000, and the ASRs of all sites combined are expected to be 135.8 and 59.0 per 100,000 (Table 4).
In 2012, the five leading cancer sites causing mortality in males are predicted to be lung (CR, 46.5; ASR, 34.4), liver (CR, 32.2; ASR, 23.5), stomach (CR, 22.2; ASR, 16.4), colon and rectum (CR, 18.3; ASR, 13.7), and pancreas (CR, 9.6; ASR, 7.1). During the same time period, in females, lung cancer (CR, 17.2; ASR, 8.7) is projected to be the leading cancer site causing mortality, followed by cancers of the colon and rectum (CR, 14.0; ASR, 7.1), stomach (CR, 12.1; ASR, 6.1), liver (CR, 11.0; ASR, 6.0), and pancreas (CR, 8.8; ASR, 4.5).
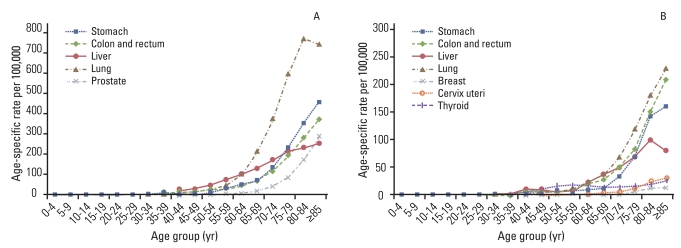
Fig. 3 shows the age-specific predicted mortality rates of the selected cancers for males and females in 2012. When examined by age, Korean males >60 years of age are expected to have the highest mortality rates from liver cancer, followed by lung cancer. In contrast, Korean females >55 years of age are expected to have the highest mortality rates from breast cancer, followed by lung cancer.
Conclusion
This report provides the estimated nationwide cancer incidence and mortality in Korea for the current year. A total of 234,727 new cancer cases and 73,313 cancer deaths are expected in Korea during 2012. In Korean males, gastric, colorectal, lung, liver, and prostate cancers are estimated to have the highest rates of incidence, while lung, liver, gastric, colorectal, and pancreatic cancers are estimated to be the most common causes of cancer-related deaths. In Korean females, thyroid, breast, colorectal, gastric, and lung cancer are estimated to have the highest rates of incidence, while lung, colorectal, stomach, liver, and pancreas cancers are estimated to be the most common causes of cancer-related deaths.
Cancer has become an important public health concern in Korea, and as the population continues to age, the cancer burden will continue to increase. The estimated cancer statistics of the current year given in this report represent an important resource to plan and evaluate cancer-control programs. The estimates in this report, however, are projected numbers based on statistical models and may vary from year to year; hence, these estimates should be used with caution.