| Home | E-Submission | Sitemap | Contact Us |  
top_img
Cancer Research and Treatment > Volume 53(2); 2021 > Article
Pih, Gong, Choi, Kim, Ahn, Choe, Bae, Chang, Na, Lee, Jung, Kim, Choi, Song, Lee, and Jung: Associations of Serum Lipid Level with Gastric Cancer Risk, Pathology, and Prognosis

Abstract

Purpose

The association of serum lipids with gastric cancer is controversial. We clarified the role of serum lipids in the development, progression, and prognosis of gastric cancer.

Materials and Methods

In total, 412 patients diagnosed with gastric cancer were prospectively recruited, and 2,934 control subjects who underwent screening endoscopy were enrolled from December 2013 to March 2017 to conduct a case-control study in a tertiary center. Serum lipid profiles, including total cholesterol, high-density lipoprotein cholesterol (HDL-C), low-density lipoprotein cholesterol (LDL-C), triglyceride (TG), apolipoprotein A-I (apoA-I), and apolipoprotein B, and clinicopathologic characteristics were analyzed.

Results

The gastric cancer group showed significantly lower HDL-C, higher LDL-C, and lower apoA-I level than the control group. In multivariate analysis, old age (odds ratio [OR], 1.051; p < 0.001), smoking (OR, 1.337; p < 0.001), a family history of gastric cancer (OR, 2.038; p < 0.001), Helicobacter pylori seropositivity (OR, 4.240; p < 0.001), lower HDL-C (OR, 0.712; p=0.020), and higher LDL-C (p=0.002) were significant risk factors for gastric cancer. Lower HDL-C and higher LDL-C remained significant after adjustments for covariates, including age and sex. In a subgroup analysis of the gastric cancer group, lower TG levels were associated with undifferentiated histology. No serum lipids were associated with overall survival.

Conclusion

Lower HDL-C and higher LDL-C were associated with the risk of gastric cancer, even after adjusting for age, sex, and other factors. In the gastric cancer group, undifferentiated histology was associated with lower TG levels.

Introduction

Gastric cancer is the second most common cancer worldwide and the third leading cause of cancer-related death [1]. Genetic and environmental factors, such as male sex, older age, smoking status, a family history of gastric cancer, Helicobacter pylori infection, and dietary habits, have been reported to be associated with gastric cancer [2]. Dyslipidemia and abnormal lipid metabolism are increasingly reported as significant mechanisms of carcinogenesis [3]. Accordingly, serum lipid components, including total cholesterol (TC), high-density lipoprotein cholesterol (HDL-C), low-density lipoprotein cholesterol (LDL-C), triglycerides (TGs), and apolipoproteins, have been investigated for their associations with cancer risk and prognosis.
However, previous studies have shown contradictory results about the effect of lipids on various cancers, including gastric cancer. TC had negative [4,5], positive [6], or no correlation [7] with gastric neoplasms. In addition, few studies have focused on the relationships of TG, LDL-C, or apolipoproteins with gastric cancer, as most reports have been based on ancillary findings observed in a study of metabolic syndrome or statins. Furthermore, previous studies have included specific underlying diseases or medications, which may affect serum lipid levels and confound interpretation of the association between serum lipids and gastric cancer.
Therefore, we conducted a prospective case-control study to clarify the association of serum lipids level including TC, HDL-C, LDL-C, TG, apolipoprotein A-I (apoA-I), and apolipoprotein B (apoB), with gastric cancer by analyzing their significance in cancer risk, pathology, and prognosis.

Materials and Methods

1. Study subjects

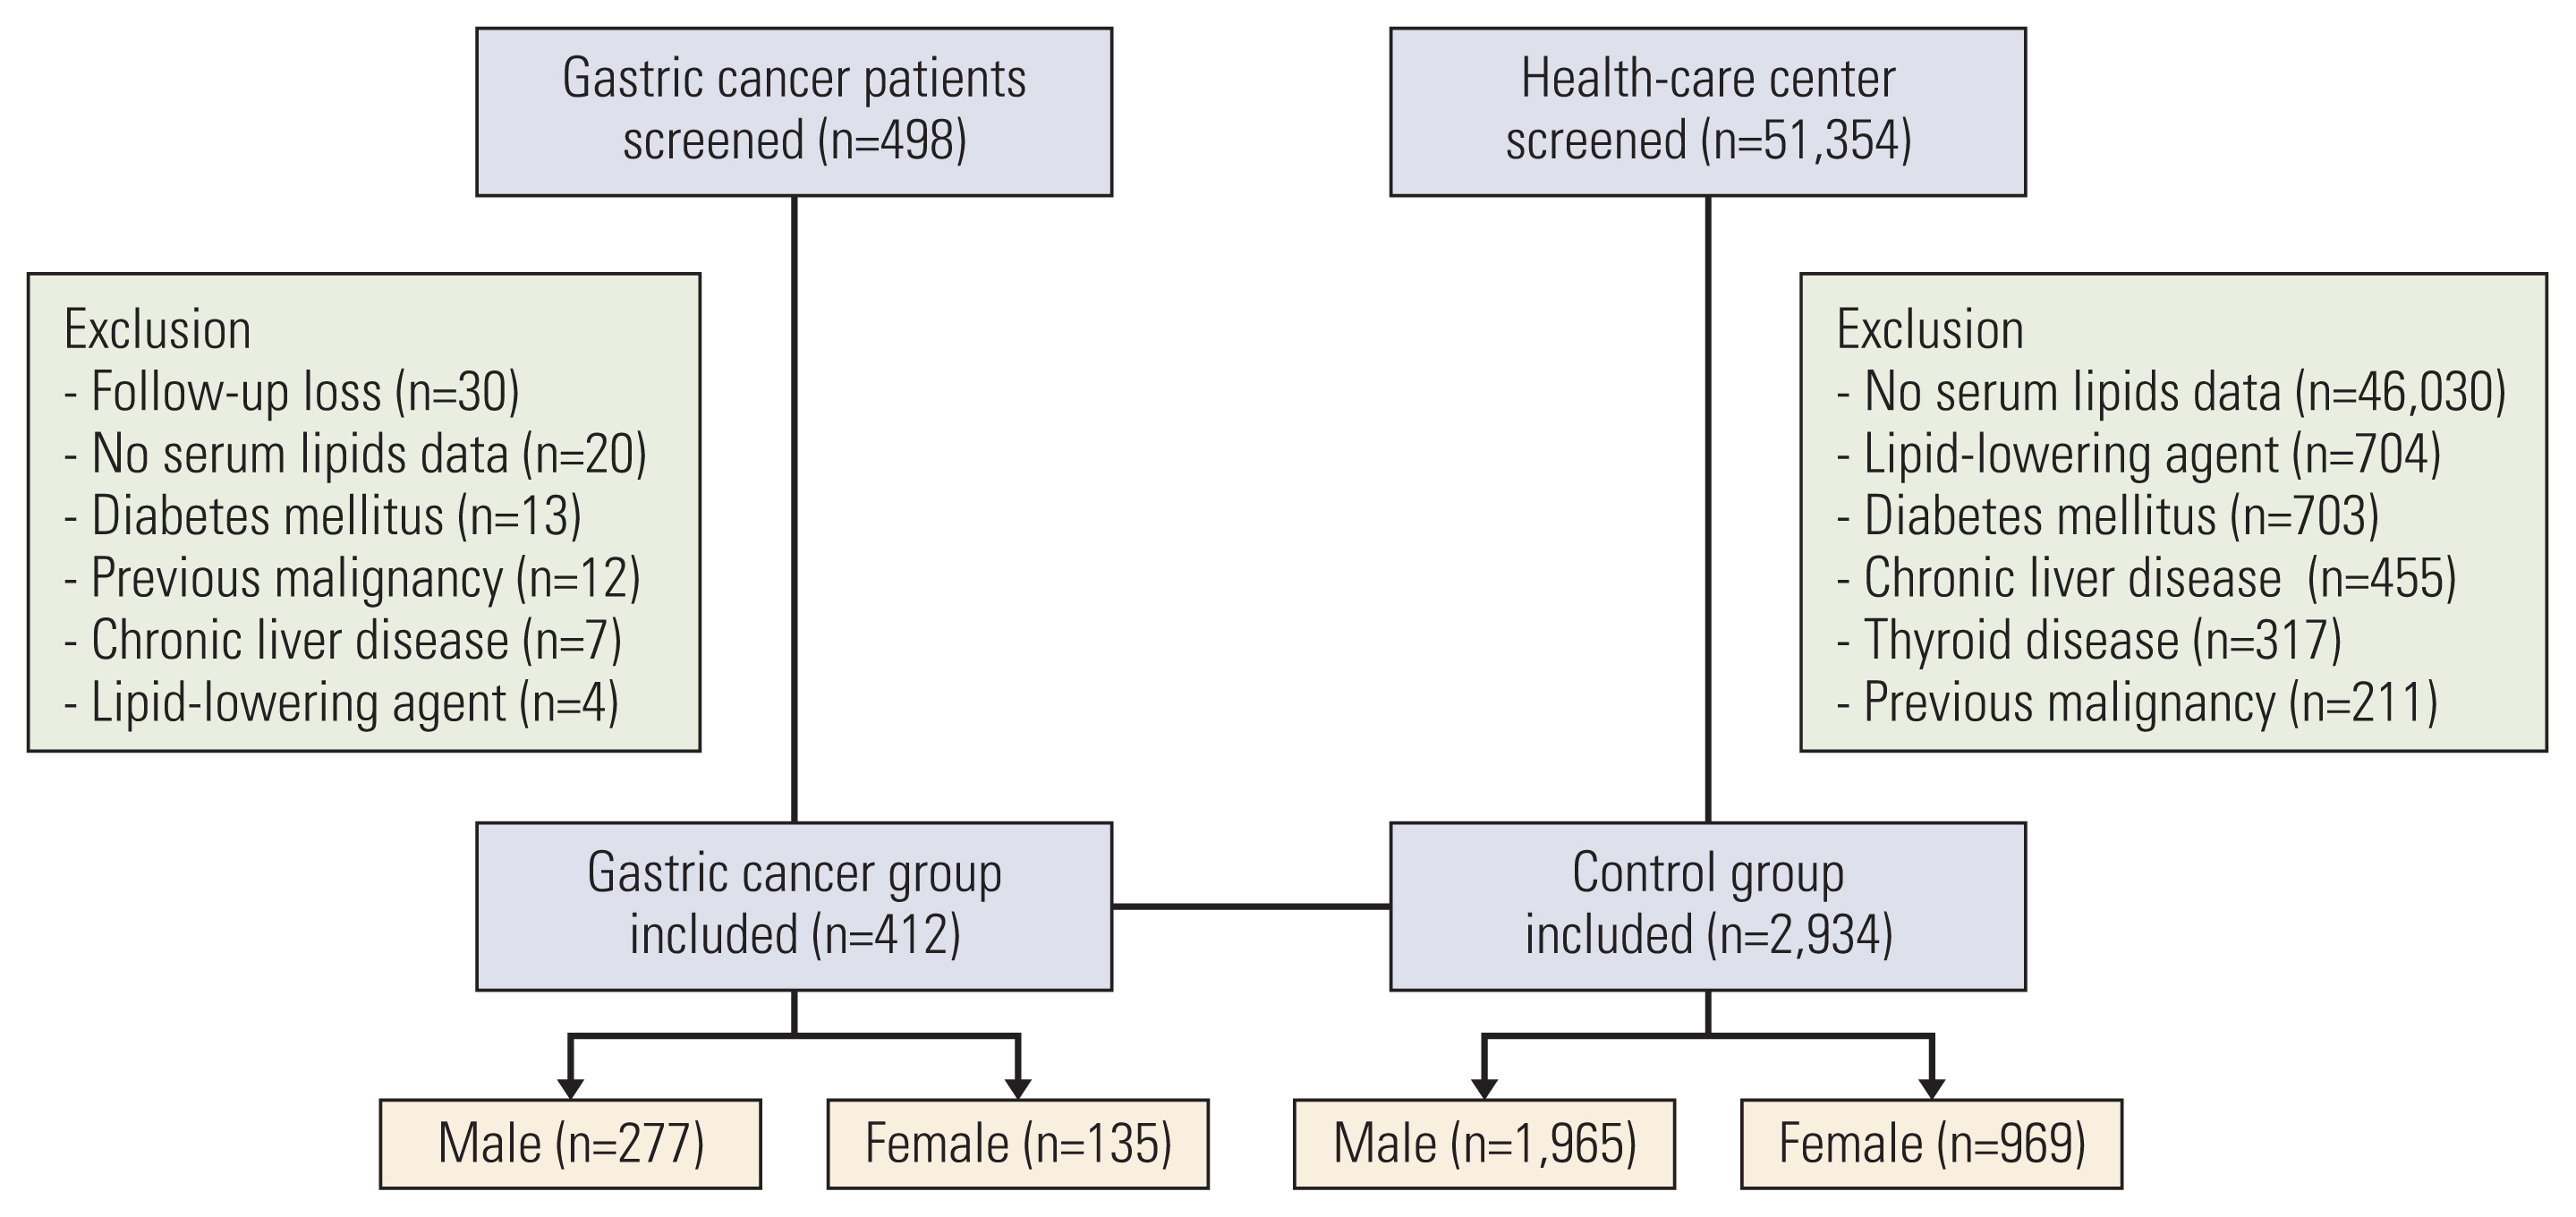
A case-control study was conducted between December 2013 and March 2017 at Asan Medical Center, Seoul, Korea. A total of 498 patients with pathologically confirmed gastric cancer were prospectively screened. To assess the association between serum lipid profile and gastric cancer, a control group was formed from a cohort of the health promotion center. Patients with diabetes mellitus, chronic liver disease, thyroid disease, a previous history of malignancy, and use of lipid-lowering agents were excluded. Subjects who did not complete a laboratory examination for lipid profiles or those who were lost to follow-up were also excluded. Finally, 412 patients with gastric cancer and 2,934 controls were analyzed (Fig. 1).

2. Data collection

All participants completed a questionnaire including information on personal and family histories of cancer. Smoking status was divided into three categories: never smokers, former smokers, and current smokers. Serologic positivity for H. pylori IgG was determined using an immunoassay system (IMMULITE 2000, Siemens Healthcare Diagnostics Products Ltd., Gwynedd, UK). The calibration range of this immunoassay is 0.4–8.0 U/mL, and H. pylori IgG titers were classified as follows: negative, 0–1.0 U/mL; positive, ≥ 1.1 U/mL. In addition, high-sensitivity C-reactive protein (hsCRP) was measured. Participants with a body mass index (BMI) of over 25 kg/m2 were defined as obese according to the classification of the World Health Organization Western Pacific Regional Office.
Gastric cancer was classified into two groups according to histopathologic findings. The differentiated group included well or moderately differentiated cancer and the undifferentiated group included poorly differentiated or signet ring cell carcinoma. Clinical staging was performed based on the 7th American Joint Committee on Cancer TNM staging system. Informed consent was obtained from patients with gastric cancer and those in the control group.

3. Serum lipid levels

All subjects were measured the serum lipids profile as the baseline level at the time of inclusion in the study. The profiles of serum lipids, including TC, HDL-C, LDL-C, TG, and apolipoproteins, were measured using a Beckman Coulter AU 5800 chemistry analyzer (Beckman Coulter, Brea, CA) after at least 12 hours of fasting. TC was categorized using cutoff values of < 160, 160–179, 180–199, 200–239, and ≥ 240 mg/dL. LDL-C was classified using cutoff values of < 100, 100–129, 130–159, and ≥ 160 mg/dL. The low and high reference values were 40 mg/dL for HDL-C, 150 mg/dL for TG, 178 mg/dL for apoA-1, and 122 mg/dL for apoB.

4. Statistical analyses

Sample size was calculated with a significance level (alpha) of 0.05 using a two-sided two-sample t test. This was based on a previous report comparing a gastric cancer group with an age- and sex-matched control group with mean LDL-C of 121 mg/dL and 127 mg/dL, respectively, and standard deviation of 35.0 [8]. The estimated sample size was 535 for each group to achieve 80% power to detect a difference between the two groups. Considering a drop-out rate of 10%, a total of 594 patients were required in each group. However, during the study period, patient recruitment took longer than expected to achieve the expected sample size. Thus, enrollment ended when 498 patients had agreed to participate in the study.
Categorical variables were analyzed using chi-square or Fisher exact tests, and continuous variables were analyzed using a Mann-Whitney U test. Logistic regression analysis was used to estimate odds ratios (ORs) and 95% confidence intervals (CIs) for the risk of developing gastric cancer associated with lipid components. Models adjusted for age, sex, and multivariate factors (including age, sex, H. pylori IgG seropositivity, BMI, smoking status, and a family history of gastric cancer) were also used. Correlation between the pathologic variables of gastric cancer and serum lipid components was analyzed using Spearman’s rank correlation analysis. Cox proportional regression analysis was used to assess prognostic factors related to the overall survival of gastric cancer. p < 0.05 were considered statistically significant. Statistical analyses were performed using SPSS statistical software ver. 21.0 (IBM Corp., Armonk, NY).

Results

1. Baseline characteristics of the study population

Median age was 56 years (interquartile range [IQR], 49 to 64) in the gastric cancer group and 53 years (IQR, 48 to 57) in the control group. Overall, 2,242 men and 1,104 women were included in the study. Baseline characteristics of the two groups are shown in Table 1. Compared with those in the control group, significantly more patients in the gastric cancer group had a family history of gastric cancer (p < 0.001) and H. pylori serum IgG positivity (p < 0.001) among the total population, male, and female groups.
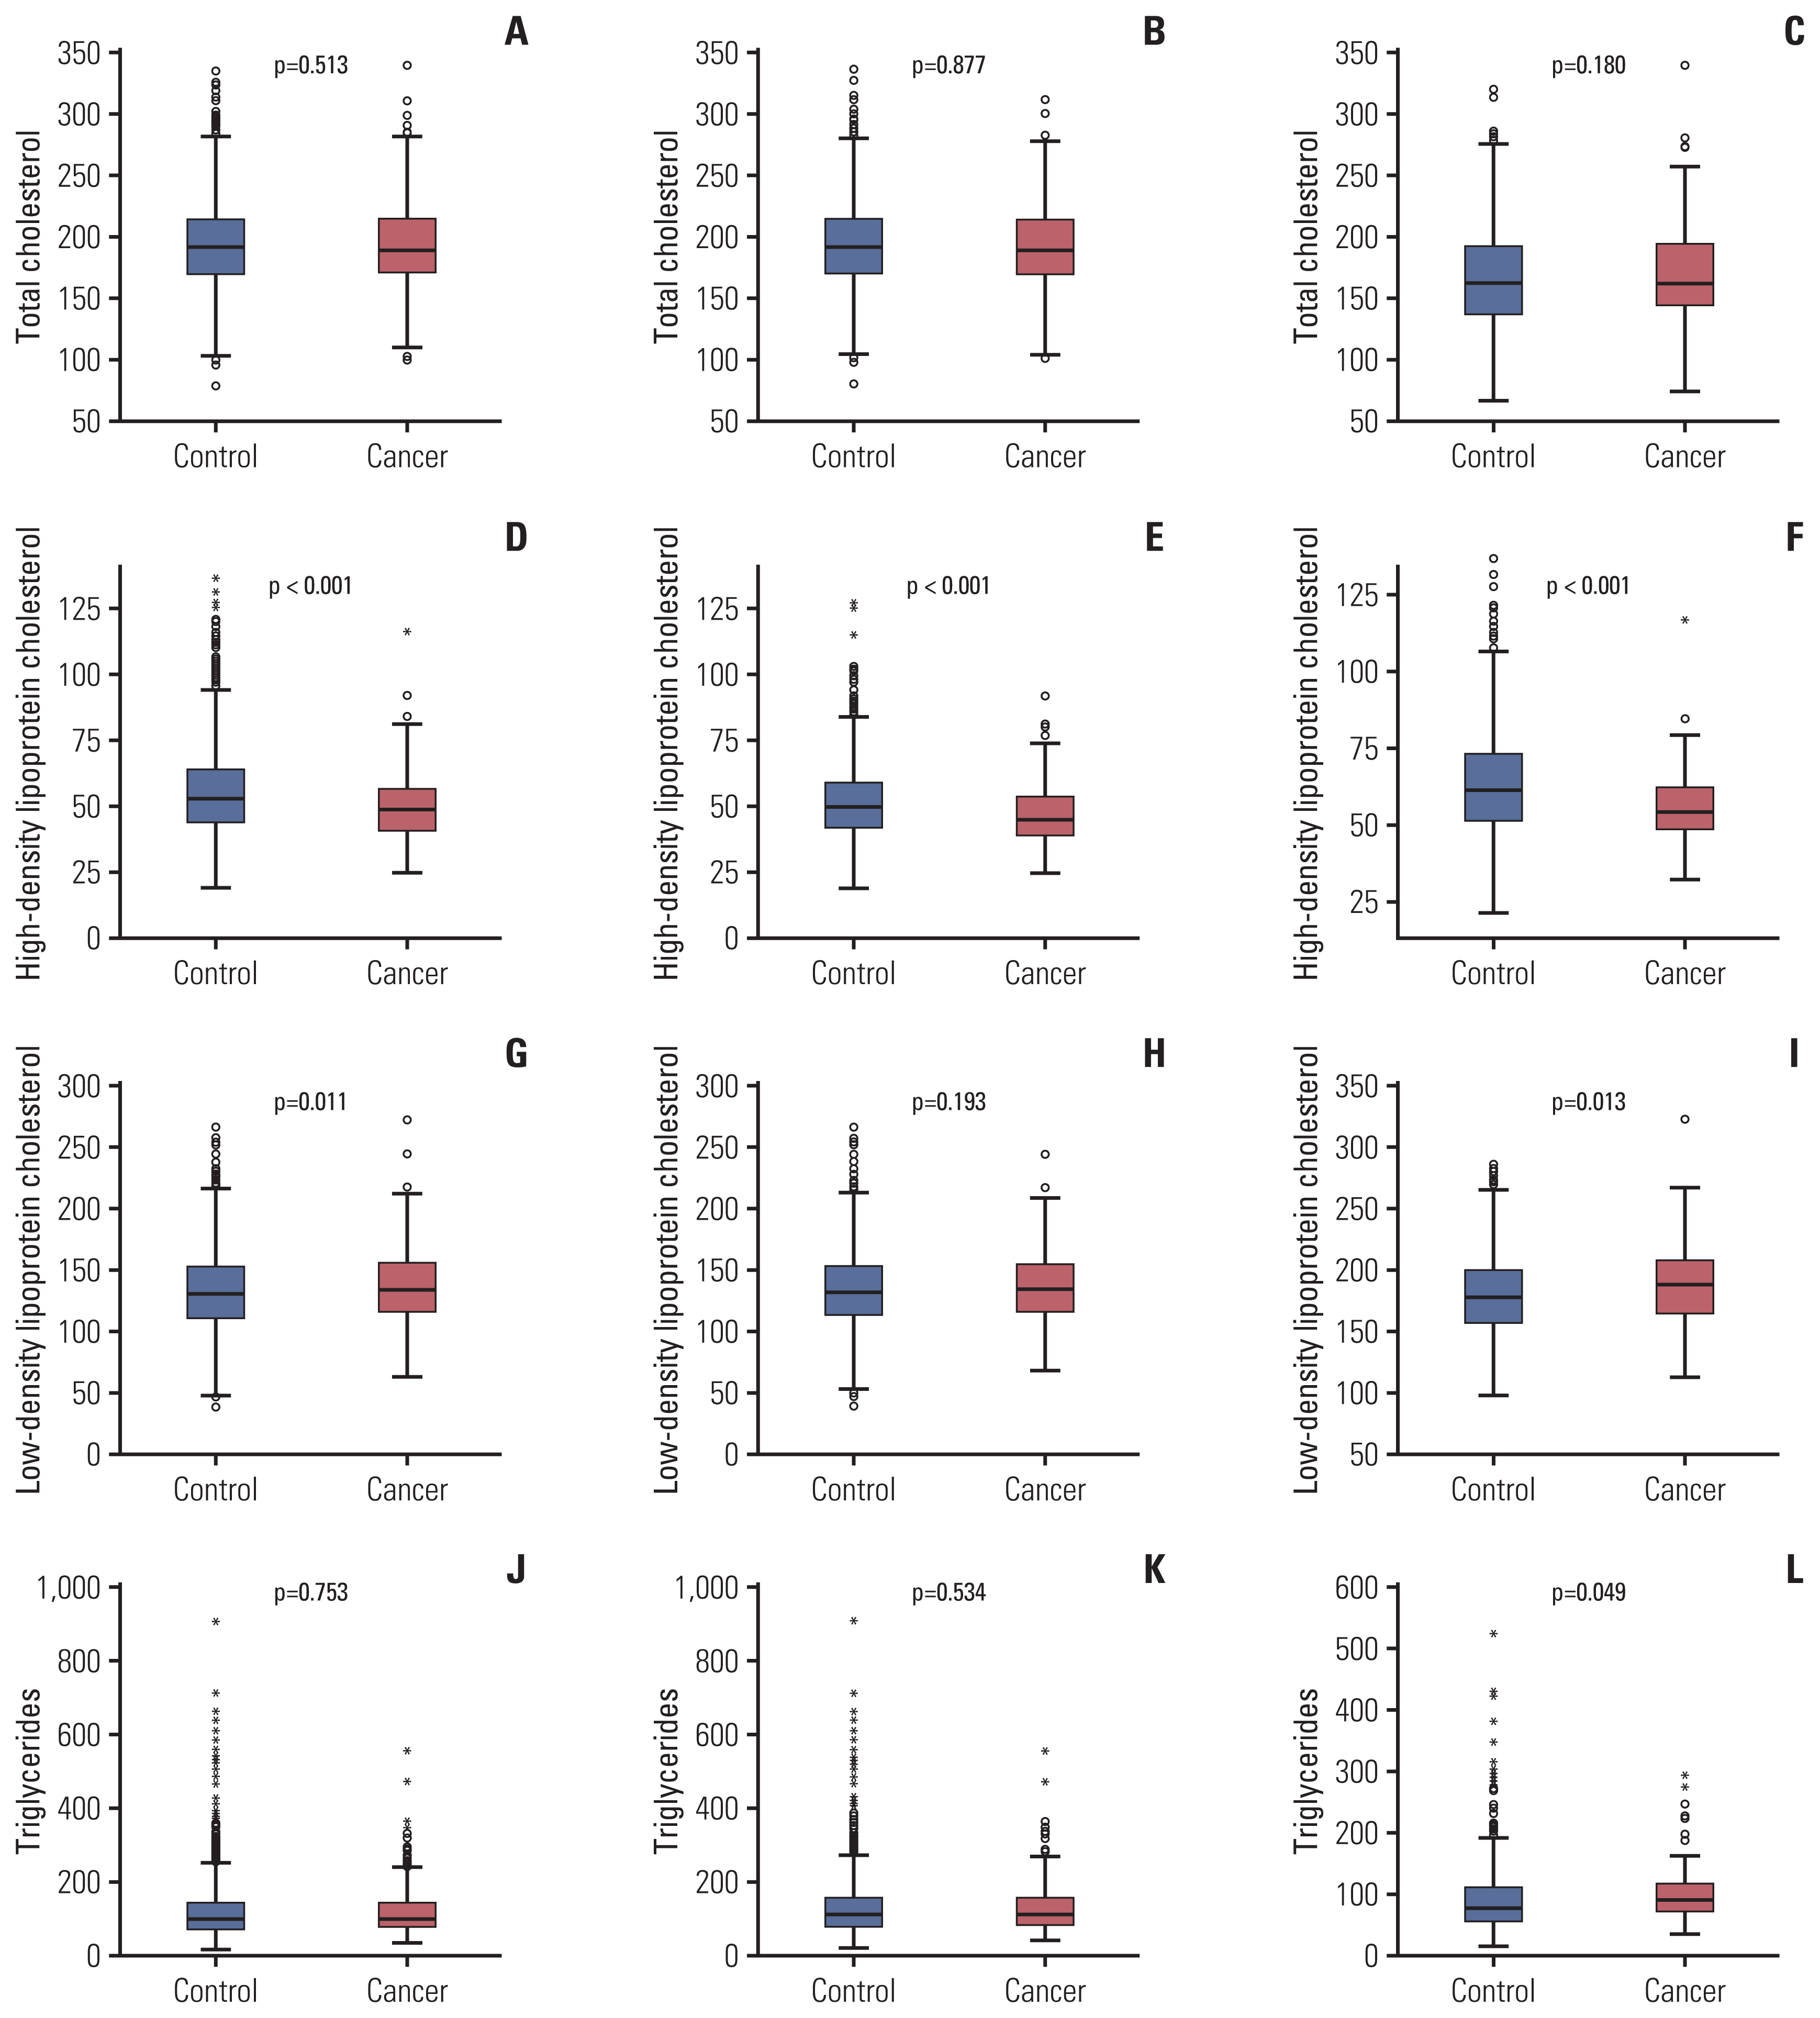
Regarding serum lipid profiles, the gastric cancer group had significantly lower HDL-C (p < 0.001), higher LDL-C (p=0.011), and lower apoA-I (p < 0.001) levels (Fig. 2). Lower HDL-C and lower apoA-I levels were found in both male and female gastric cancer groups; however, the male gastric cancer group also had lower apoB levels and the female gastric cancer group had higher LDL and TG levels than the control group.

2. Clinicopathologic characteristics of gastric cancer

The clinicopathologic characteristics of 412 patients with gastric cancer, including 277 men and 135 women, are summarized in Table 2. Compared to the male group, the female group had a significantly higher proportion of undifferentiated histology (67.4% vs. 47.3%, p < 0.001).
The male group had significantly lower HDL-C (median, 45 mg/dL vs. 54 mg/dL; p < 0.001), higher TG (median, 103 vs. 88 mg/dL; p < 0.001), and lower apoA-I (median, 133.6 mg/dL vs. 147.6 mg/dL; p < 0.001) levels than the female group, but there were no remarkable differences in serum TC and LDL-C levels between the male and female groups.

3. Serum lipid levels and gastric cancer risk

Univariate analysis showed that old age, smoking, a family history of gastric cancer, H. pylori IgG positivity, lower HDL-C, higher LDL-C, and lower apoA-I as significant factors for gastric cancer (Table 3). Multivariate analysis showed that old age (OR, 1.051; p < 0.001), smoking status (OR, 1.054; p=0.019), a family history of gastric cancer (OR, 2.038; p < 0.001), H. pylori IgG positivity (OR, 4.240; p < 0.001), lower HDL-C (OR, 0.712; p=0.020), and higher LDL-C (LDL-C, 100–129: OR, 1.202; p=0.004 and LDL-C, 130–159: OR, 1.854; p=0.002) were significantly associated with gastric cancer.
The ORs for gastric cancer based on serum lipid level categories are shown in Table 4. After adjusting for age and sex, HDL-C (OR, 0.620; 95% CI, 0.475 to 0.809) and apoA-I (OR, 0.580; 95% CI, 0.376 to 0.859) were inversely correlated with gastric cancer, while LDL-C (LDL-C, 100–129: adjusted OR, 1.831; LDL-C, 130–159: adjusted OR, 1.915; LDL-C, ≥ 160: adjusted OR, 1.774) was positively associated with gastric cancer. After multivariate factors, including age, sex, H. pylori IgG positivity, BMI, smoking status, and a family history of gastric cancer, were adjusted, HDL-C (adjusted OR, 0.723; 95% CI, 0.542 to 0.965) and LDL-C (LDL, 100–129: adjusted OR, 1.815; LDL, 130–159: adjusted OR, 1.897; and LDL ≥ 160: adjusted OR, 1.554) were associated with gastric cancer.

4. Serum lipid levels and gastric cancer characteristics

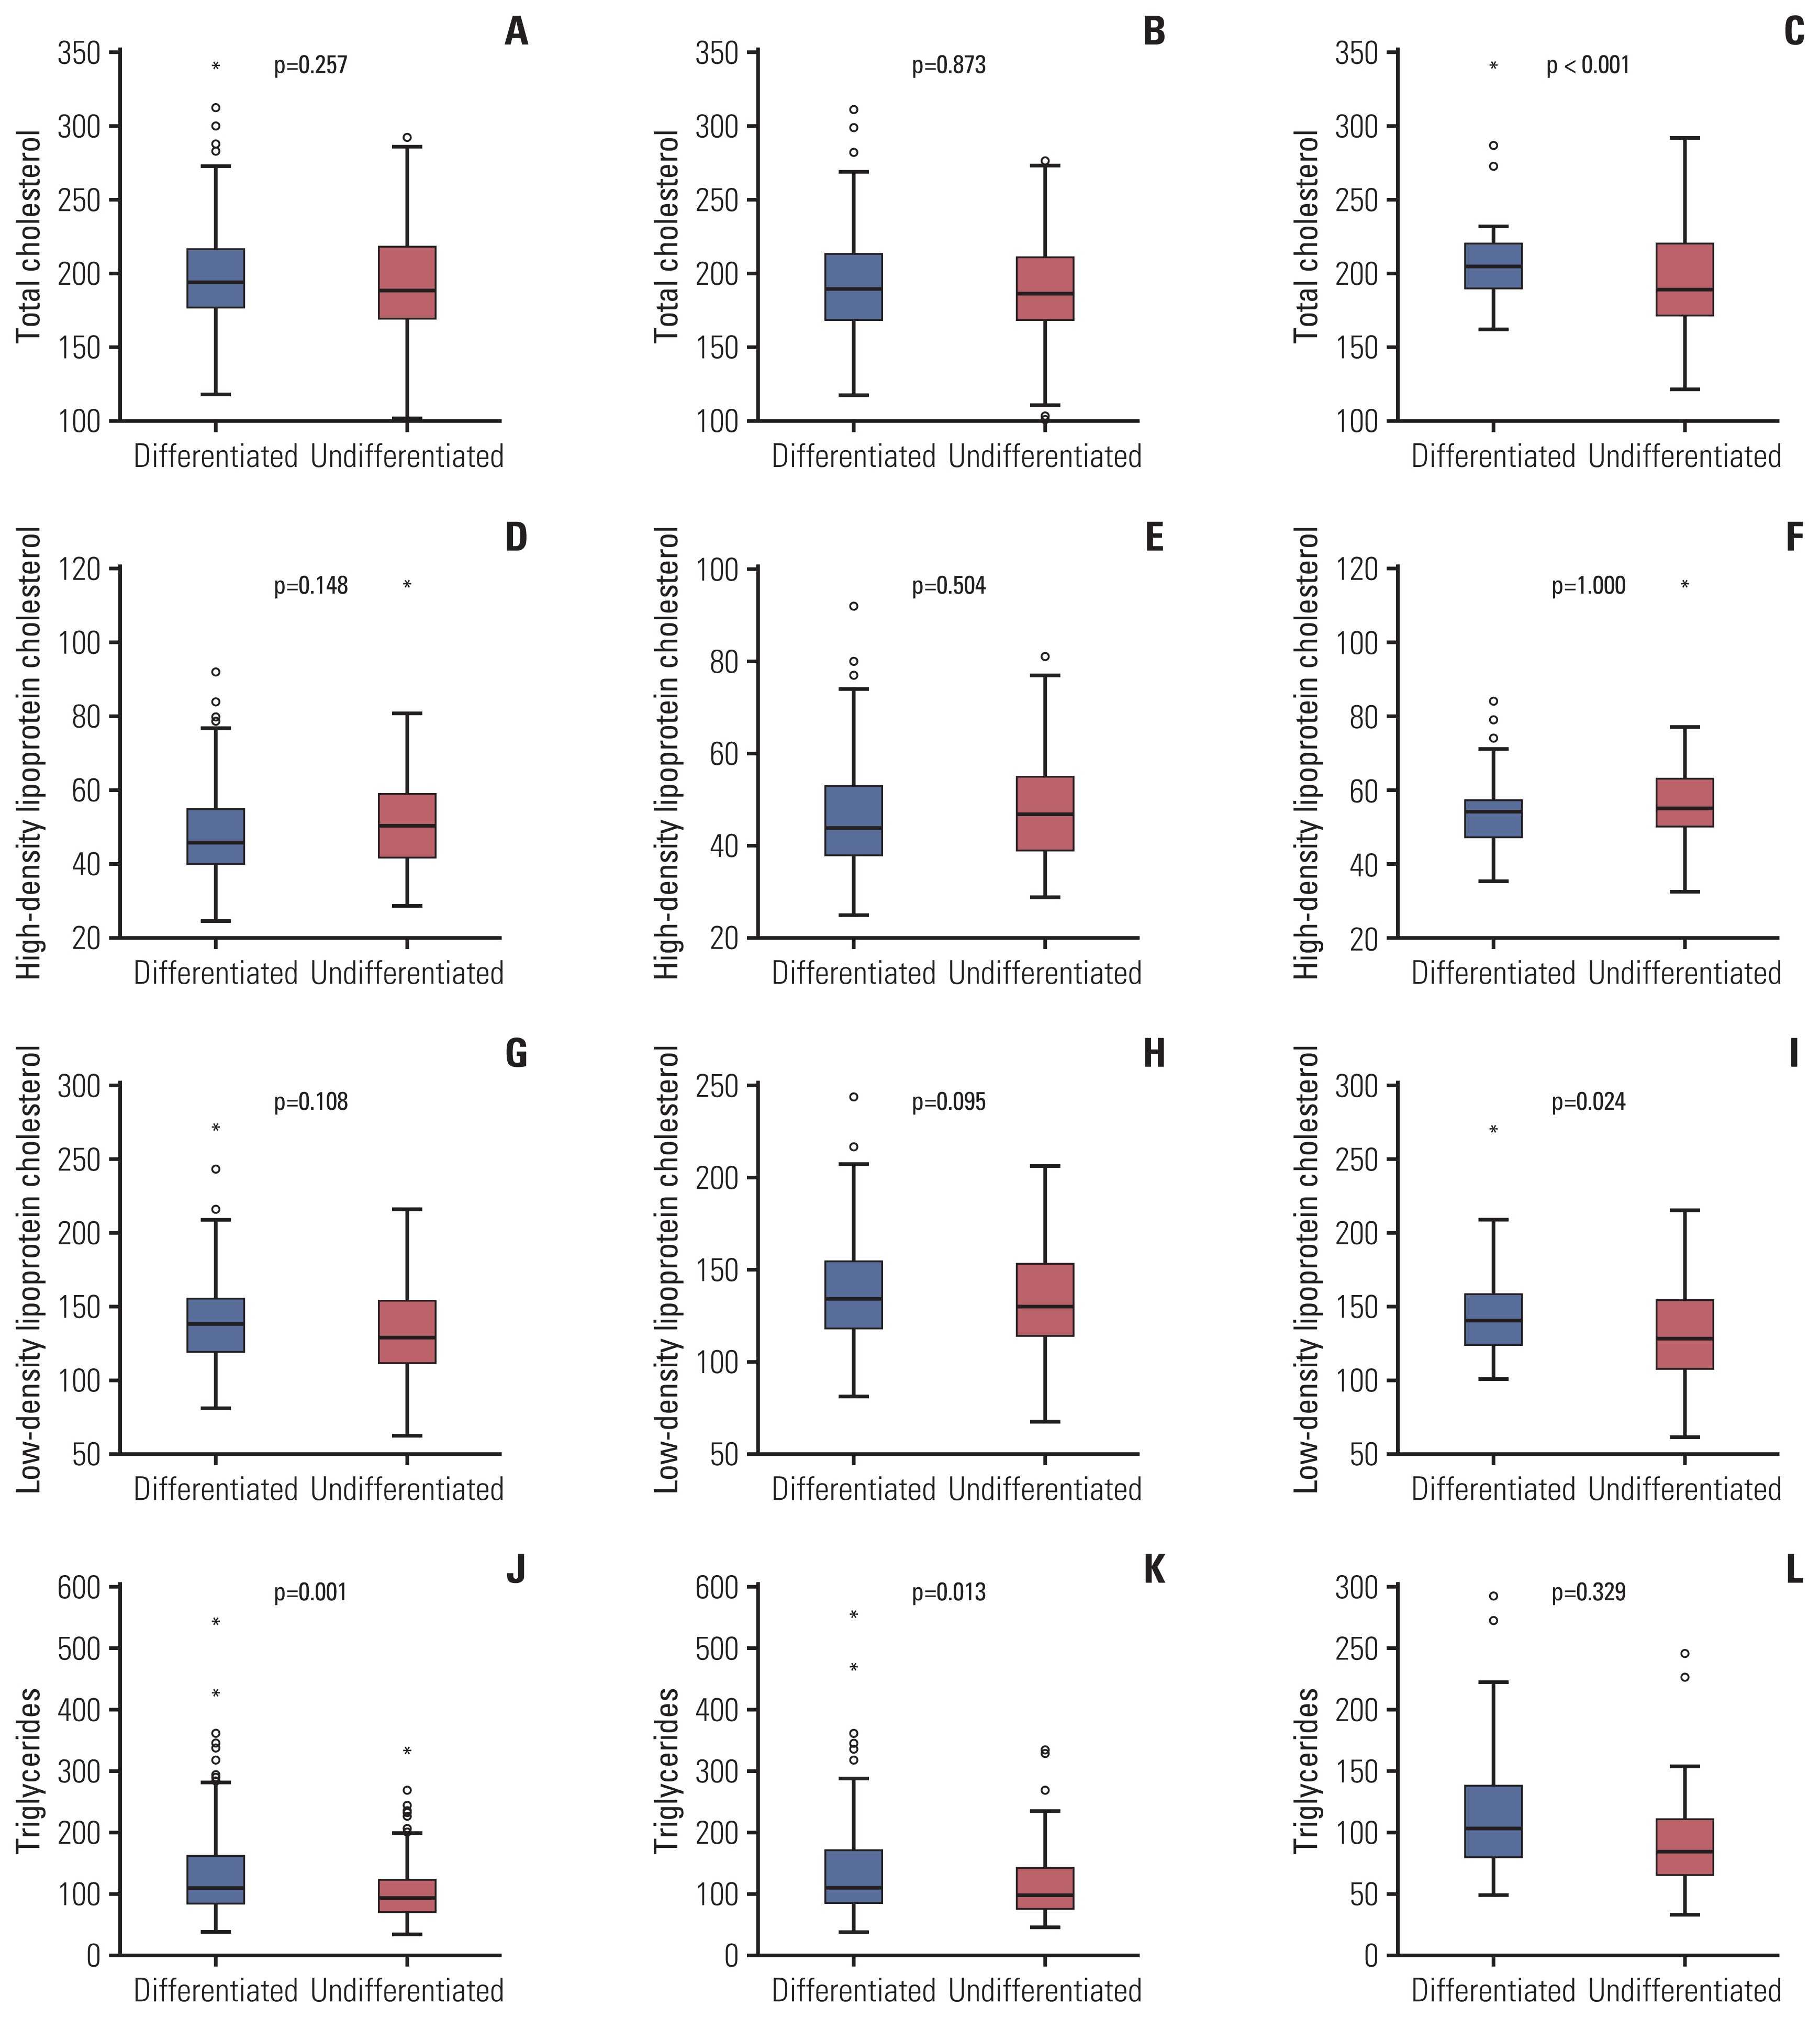
Serum lipids levels (TC, TG, HDL-C, LDL-C, apoA-I, and apoB) showed no correlation with cancer size or stage according to pathology reports in the total population group. Lower TG was correlated with undifferentiated histology in the total population group (p=0.001) and the male group (p=0.013) (Table 5). In the female group, TG was lower in the undifferentiated cancer group; however, the difference was not statistically significant (p=0.329). In addition, lower TC and lower LDL-C were associated with undifferentiated histology (p < 0.001 and p=0.024, respectively) (Fig. 3) in the female group.

5. Serum lipid levels and gastric cancer prognosis

During a median follow-up of 55 months (IQR, 42 to 61), 41 patients (10%) in the gastric cancer group died. In Cox-regression multivariate analysis, smoking (hazard ratio [HR], 4.283; p=0.003), advanced stage (stage II: HR, 3.022; p=0.094; stage III: HR, 3.298; p=0.031, and stage IV: HR, 376.884; p < 0.001), and hsCRP (HR, 2.161; p=0.003) were significant factors for overall survival of patients with gastric cancer (Table 6). Both male and female groups showed no association between any component of serum lipid levels or overall survival.

Discussion

The association of gastric cancer with serum lipid levels, including TC, HDL-C, LDL-C, TG, and apolipoproteins, has been researched with inconsistent and contradictory results, and no consensus of their significance has been established. This study was conducted to clarify the association between serum lipid components and gastric cancer. Lower HDL-C and higher LDL-C were determined to be risk factors for gastric cancer, and TG was correlated with cancer differentiation. None of the serum lipids were shown to be prognostic factors for the overall survival of gastric cancer. Analysis of risk and prognostic factors were identical in the male, female, and total population groups.
Previous epidemiologic studies reported that HDL-C and LDL-C were involved in cancer development. Lower HDL-C levels have been associated with increased gastric cancer risk, regardless of ethnicity [9,10]. HDL-C is known as an antioxidant and anti-inflammatory factor in cancer [11]. In addition, reduced HDL-C levels in patients with gastric cancer may be explained by the development of HDL receptors to prevent the accumulation of intracellular cholesterol during tumor development [12]. Furthermore, H. pylori infection has been reported to reduce HDL-C levels [13]. As H. pylori is a significant risk factor for gastric cancer, the association of low HDL-C and gastric cancer can be deduced.
Elevated LDL-C and reduced HDL-C are reportedly related to pro-inflammatory activity, and tumors including gastric cancer exhibit abnormal regulation of specific genes related to the LDL receptor [14]. Higher LDL-C was associated with increased gastric cancer risk in previous case-control studies [15,16]. In addition, high levels of LDL-C have been reported to affect the suppression of the host immune system [17]. Recent studies have demonstrated that statins, lowering LDL-C by inhibiting 3-hydroxy-3-methylglutaryl coenzyme A reductase, reduced the risk of gastric cancer by inhibiting cancer cell growth and cell death [18]. In this study, lower HDL-C and higher LDL were risk factors for gastric cancer in the age/sex-adjusted multivariate analysis and in the full multivariate-adjusted model.
Similar to our study where no association of TG or TC with gastric cancer was shown, previous large cohort studies have shown the irrelevance of TG [10,19,20] and TC with gastric cancer [5]. Few studies have reported contradictory results showing the association of higher TG and gastric cancer [21] and inverse correlation of TC with gastric cancer [22]. Based on research that TG and TC are regulated by insulin and that hyperinsulinemia is related to carcinogenesis [23], TG and TC might mediate carcinogenesis rather than act as independent risk factors.
TG has been reported as an independent indicator for fatty acid oxidation involving tumor cell proliferation and growth [24]. In this study, TG was correlated with cancer differentiation in the total population and male groups. Several studies have shown that TG-rich remnant like particles regulate pathways inducing cell proliferation and cancer-associated cell growth [25]. Furthermore, very low-density lipoprotein receptor expression, which significantly participates in TG metabolism, was reportedly correlated with gastrointestinal cancer differentiation [26].
To date, few studies have investigated the association between gastric cancer differentiation and serum lipid components. One previous study suggested that TG was associated with poor gastric cancer differentiation [27]. In this study, differentiation was correlated with TG levels in both total population and male groups, but it was associated with TC and HDL-C in the female group. Baseline TC and LDL-C levels showed no significant differences between the male and female groups. A previous study demonstrated that intestinal type gastric cancer was frequent in men and diffuse type cancer developed more in women [28]. One possible explanation is that differences in the association between cancer differentiation and serum lipids may result from different compositions of diffuse and intestinal type cancer according to sex.
Despite research predicting the prognosis of gastric cancer by serum lipid levels, there have been no remarkable findings published showing an association. A previous study reported that lipid markers including HDL-C, LDL-C, and TG did not have a prognostic significance in gastric cancer [29]. One previous study that retrospectively analyzed 184 patients showed that low HDL-C was a poor prognostic factor in patients with gastric cancer, but the study had a small sample size and was limited by its retrospective design [30]. Another study showed LDL-C as an independent risk factor for death from gastric cancer [8]. In this study, the baseline serum levels of TC, HDL-C, LDL-C, TG, apoA-I, and apoB showed no association with the overall survival of gastric cancer. A strength of our study was that baseline diseases or medications that affect serum lipids, such as lipid-lowering agents, were excluded. However, cancer treatment such as gastrectomy can change postoperative lipid levels along with changes in dietary habits. As such, future studies should serially follow serum lipid levels to elucidate associations with gastric cancer.
This study has several limitations. First, serum lipid levels were measured only once when the patients were enrolled in the study as a baseline value; however the serum lipids level may change over time depending on the patient’s clinical course and disease status. In addition, 311 patients (75.5%) were diagnosed with early gastric cancer which is higher proportion than advanced gastric cancer. Considering that weight loss is presented more frequently in patients with advanced gastric cancer than early gastric cancer, comparison between the two groups would be necessary to further clarify the association between lipid profile and gastric cancer. Second, this is a case-control study from a single tertiary center. Several studies on serum lipid levels have shown inconsistent results between different ethnicities, and multinational and multicenter research will further clarify the role of lipids in patients with gastric cancer. Third, the gastric cancer group included patients who visited an out-patient clinic after diagnosis or suspicion of cancer, while the control group comprised of people who visited the health care center for regular health examinations. Although we had adjusted for sex, age, H. pylori infection, and smoking in the multivariate analysis, selection bias may remain. In addition, individuals who voluntarily participate in routine health check-ups may have more awareness of healthcare than those who do not, and this may have resulted in significant differences in age and smoking status in this study. Lastly, information on social status and dietary habits, which can be risk factors for gastric cancer, were not included. However, we adjusted for multivariate factors, including age, sex, BMI, H. pylori IgG positivity, a history of gastric cancer, and smoking status. Nonetheless, this study included a large number of subjects.
In conclusion, serum lipid profiles are associated with the development of gastric cancer, but not with prognosis. Lower HDL-C and higher LDL-C levels were risk factors for gastric cancer, suggesting that serum lipid levels may be used as predictive factors for screening and follow-up of gastric cancer. In addition, TG levels were correlated with gastric cancer differentiation, but no serum lipid components were associated with overall survival. Ultimately, studies showing the association of serum lipid levels and gastric cancer will be fundamental in determining screening models related to lipid metabolism.

Notes

Ethical Statement

The study protocol was reviewed and approved by the Institutional Review Board of Asan Medical Center (number: 2013-0973) and performed according to the ethical principles of the Declaration of Helsinki (clinicalTrials.gov Identifier: NCT0041312). All authors had access to the study data and approved the final manuscript.

Author Contributions

Conceived and designed the analysis: Pih GY, Gong EJ, Choi JY, Ahn JY, Choe J.

Collected the data: Pih GY, Gong EJ, Choi JY, Bae SE, Chang HS, Na HK, Lee JH, Jung KW, Kim DH, Choi KD, Song HJ, Lee GH, Jung HY.

Contributed data or analysis tools: Pih GY, Gong EJ, Ahn JY, Choe J, Bae SE, Chang HS, Na HK, Lee JH, Jung KW, Kim DH, Choi KD, Song HJ, Lee GH, Jung HY.

Performed the analysis: Pih GY, Gong EJ, Kim MJ, Ahn JY, Choe J.

Wrote the paper: Pih GY.

Conflicts of Interest

Conflict of interest relevant to this article was not reported.

Acknowledgments

This work was supported by the Korean College of Helicobacter and Upper Gastrointestinal Research Foundation Grant.

Fig. 1
Study flowchart.
crt-2020-599f1.jpg
Fig. 2
Comparison of serum lipid levels the between control and gastric cancer groups. Comparison of total cholesterol levels between the gastric cancer and control groups among the total population (A), male (B), and female (C) groups. High-density lipoprotein cholesterol levels were significantly lower in the gastric cancer group than in the total population (D), male (E), and female (F) control groups. Low-density lipoprotein cholesterol levels were higher in the gastric cancer group (G-I). No significant association was found between triglyceride levels and gastric cancer in the (J) total population or (K) male group, but a significant association was found in the (L) female group.
crt-2020-599f2.jpg
Fig. 3
Comparison of serum lipid levels between differentiated and undifferentiated gastric cancer groups. Total cholesterol levels showed no significant difference between the differentiated and undifferentiated gastric cancer subgroups among the total population (A) and male groups (B), but a significant difference was seen in the female group (C). No significant association was found between high-density lipoprotein cholesterol and differentiation in the total population (D), male (E), and female (F) groups. Low-density lipoprotein had no significant difference between the differentiated and undifferentiated gastric cancer subgroups in the total population (G) and male groups (H), but a significant difference was seen in the female group (I). Triglyceride levels were lower in the undifferentiated subgroup than in the total population (J), male (K), and female (L) groups.
crt-2020-599f3.jpg
Table 1
Baseline characteristics of gastric cancer and control groups
Total Male group Female group


Gastric cancer (n=412) Control (n=2,934) p-value Gastric cancer (n=277) Control (n=1,965) p-value Gastric cancer (n=135) Control (n=969) p-value
Age (yr) 56 (49–64) 53 (48–57) < 0.001 58 (51–66) 53 (48–57) < 0.001 52 (47–59) 53 (48–58) 0.954

BMI (kg/m2) 23.7 (21.9–25.7) 23.8 (21.9–25.7) 0.769 24.1 (22.2–25.9) 24.3 (22.7–26.0) 0.194 22.6 (21.2–24.5) 22.2 (20.5–24.4) 0.152

Serum lipid level (mg/dL)

 Total cholesterol 191 (172–216) 192 (170–215) 0.513 189 (169–213) 191 (170–214) 0.877 193 (178–220) 193 (172–218) 0.180

 HDL-C 49 (41–57) 53 (44–64) < 0.001 45 (39–54) 50 (42–59) < 0.001 54 (48–62) 61 (51–73) < 0.001

 LDL-C 133 (115–154) 130 (110–152) 0.011 133 (115–153) 131 (112–152) 0.193 137 (114–157) 127 (106–150) 0.013

 Triglyceride 97 (74–139) 96 (67–140) 0.753 103 (78–157) 108 (76–154) 0.534 88 (69–114) 75 (54–108) 0.049

 Apolipoprotein A-I 140.5 (121.1–155.6) 145.0 (129.8–162.5) < 0.001 133.6 (117.5–150.8) 140.0 (126.9–156.8) < 0.001 147.6 (132.9–162.0) 154.2 (138.5–171.6) < 0.001

 Apolipoprotein B 99.8 (84.1–113.8) 102.0 (87.4–117.1) 0.107 100.0 (86.4–114.5) 104.0 (90.5–119.3) 0.044 98.4 (80.5–113.0) 96.6 (82.0–113.1) 0.961

hsCRP (mg/dL) 0.07 (0.03–0.17) 0.05 (0.03–0.10) < 0.001 0.07 (0.04–0.18) 0.06 (0.04–0.11) 0.001 0.05 (0.03–0.14) 0.04 (0.03–0.09) 0.031

Smoking status

 Never smoker 201 (48.8) 1,350 (46.0) < 0.001 73 (26.4) 456 (23.2) < 0.001 128 (94.8) 894 (92.4) 0.120

 Former smoker 85 (20.6) 921 (31.4) 84 (30.3) 880 (44.8) 1 (0.7) 41 (4.2)

 Current smoker 126 (30.6) 661 (22.5) 120 (43.3) 628 (32.0) 6 (4.4) 33 (3.4)

Family history of gastric cancer 88 (21.4) 340 (11.6) < 0.001 50 (18.1) 218 (11.1) 0.001 38 (28.1) 122 (12.6) < 0.001

Helicobacter pylori IgG seropositivity 328 (79.6) 1,368 (46.6) < 0.001 217 (78.3) 916 (46.6) < 0.001 111 (82.2) 452 (46.6) < 0.001

Values are presented as median (IQR) or number (%). BMI, body mass index; HDL-C, high-density lipoprotein cholesterol; hsCRP, high-sensitivity C-reactive protein; IQR, interquartile range; LDL-C, low-density lipoprotein cholesterol.

Table 2
Clinicopathologic characteristics of patients with gastric cancer
Total (n=412) Men (n=277) Women (n=135) p-value
Age (yr) 56 (49–64) 58 (51–66) 52 (47–59) < 0.001
BMI (kg/m2) 23.7 (21.9–25.7) 24.1 (22.2–25.9) 22.6 (21.2–24.5) 0.001
Diagnosis
 Early gastric cancer 311 (75.5) 201 (72.6) 110 (81.5) 0.051
 Advanced gastric cancer 101 (24.5) 76 (27.4) 25 (18.5)
Location in the stomach
 Proximal 69 (16.7) 45 (16.2) 24 (17.8) 0.779
 Distal 343 (83.3) 232 (83.8) 111 (82.2)
Maximal diameter (cm) 2.5 (1.5–4.2) 2.6 (1.6–4.3) 2.4 (1.4–4.0) 0.825
Differentiation
 Differentiated 190 (46.1) 146 (52.7) 44 (32.6) < 0.001
 Undifferentiated 222 (53.9) 131 (47.3) 91 (67.4)
Stage
 I 317 (77.5) 209 (76.3) 108 (80.0) 0.797
 II 31 (7.6) 23 (8.4) 8 (5.9)
 III 44 (10.8) 30 (10.9) 14 (10.4)
 IV 17 (4.2) 12 (4.4) 5 (3.7)
Serum lipid level (mg/dL)
 Total cholesterol 191 (172–216) 189 (169–213) 193 (178–220) 0.058
 HDL-C 49 (41–57) 45 (39–54) 54 (48–62) < 0.001
 LDL-C 133 (115–155) 133 (115–153) 137 (114–157) 0.590
 Triglyceride 97 (74–139) 103 (78–157) 88 (69–114) < 0.001
 Apolipoprotein A-I 140.5 (121.1–155.6) 133.6 (117.6–150.8) 147.6 (132.9–162.0) < 0.001
 Apolipoprotein B 99.8 (84.1–113.8) 100.0 (86.4–114.5) 98.4 (80.5–113.0) 0.097
Smoking status
 Never smoker 201 (48.8) 73 (26.4) 128 (94.8) < 0.001
 Former smoker 85 (20.6) 84 (30.3) 1 (0.7)
 Current smoker 126 (30.6) 120 (43.3) 6 (4.4)
Family history of gastric cancer 88 (21.4) 50 (18.1) 38 (28.1) 0.021
Helicobacter pylori IgG seropositivity 328 (79.6) 217 (78.3) 111 (82.2) 0.435

Values are presented as median (IQR) or number (%). BMI, body mass index; HDL-C, high-density lipoprotein cholesterol; IQR, interquartile range; LDL-C, low-density lipoprotein cholesterol.

Table 3
Univariate and multivariate analyses for gastric cancer risk factors
Univariate analysis Multivariate analysis


OR 95% CI p-value OR 95% CI p-value
Age 1.048 1.036–1.059 < 0.001 1.051 1.039–1.065 < 0.001

Sex 0.988 0.793–1.231 0.916

BMI 0.995 0.963–1.029 0.769

Smoking

 Never smoker > 0.99 > 0.99

 Former smoker 0.620 0.475–0.810 < 0.001 0.598 0.452–0.792 < 0.001

 Current smoker 1.280 1.006–1.630 0.045 1.377 1.054–1.800 0.019

Family history 2.072 1.596–2.691 < 0.001 2.038 1.539–2.698 < 0.001

Helicobacter pylori IgG seropositivity 4.470 3.480–5.742 < 0.001 4.240 3.281–5.481 < 0.001

Total cholesterol 1.021 0.939–1.111 0.624

HDL-C ≥ 40 0.624 0.482–0.806 < 0.001 0.712 0.535–0.947 0.020

LDL-C

 < 100 > 0.99 > 0.99

 100–129 1.775 1.213–2.597 0.003 1.792 1.202–2.670 0.004

 130–159 1.938 1.322–2.839 0.001 1.854 1.243–2.766 0.002

 ≥ 160 1.743 1.152–2.638 0.009 1.542 0.998–2.382 0.051

Triglyceride ≥ 150 0.976 0.757–1.259 0.853

Apolipoprotein A-I ≥ 178 0.564 0.376–0.847 0.006 0.691 0.452–1.057 0.089

Apolipoprotein B ≥ 122 0.843 0.638–1.113 0.228

BMI, body mass index; CI, confidence interval; HDL-C, high-density lipoprotein cholesterol; LDL-C, low-density lipoprotein cholesterol; OR, odds ratio.

Table 4
Serum lipid levels associated with gastric cancer (age-, sex-, and multivariate-adjusted ORs and 95% CIs)
Gastric cancer/Total (%) Age- and sex-adjusted model Multivariate-adjusted modela)


OR 95% CI p-value OR 95% CI p-value
Total cholesterol

 < 160 63/519 (12.1) > 0.99 > 0.99

 160–179 75/637 (11.8) 1.021 0.711–1.467 0.909 1.041 0.711–1.524 0.836

 180–199 103/800 (12.9) 1.136 0.808–1.597 0.462 1.125 0.786–1.610 0.520

 200–239 172/1,084 (11.7) 0.981 0.708–1.361 0.910 0.965 0.683–1.363 0.839

 ≥ 240 44/306 (14.4) 1.346 0.883–2.051 0.167 1.281 0.824–1.992 0.272

HDL-C

 < 40 88/513 (17.2) > 0.99 > 0.99

 ≥ 40 324/2,833 (11.4) 0.620 0.475–0.809 < 0.001 0.723 0.542–0.965 0.028

LDL-C

 < 100 36/476 (7.6) > 0.99 > 0.99

 100–129 149/1,175 (12.7) 1.831 1.245–2.693 0.002 1.815 1.215–2.713 0.004

 130–159 146/1,067 (13.7) 1.915 1.301–2.819 0.001 1.897 1.267–2.841 0.002

 ≥ 160 78/625 (12.5) 1.774 1.167–2.698 0.007 1.554 1.002–2.409 0.049

Triglyceride

 < 150 327/2,644 (12.4) > 0.99 > 0.99

 ≥ 150 85/702 (12.1) 1.047 0.805–1.361 0.731 0.994 0.753–1.313 0.968

Apolipoprotein A-I

 < 178 279/2,984 (12.7) > 0.99 > 0.99

 ≥ 178 27/356 (7.6) 0.580 0.384–0.878 0.010 0.657 0.430–1.004 0.052

Apolipoprotein B

 < 122 337/2,711 (12.4) > 0.99 > 0.99

 ≥ 122 67/627 (10.7) 0.842 0.636–1.115 0.230 0.751 0.560–1.008 0.056

CI, confidence interval; HDL-C, high-density lipoprotein cholesterol; LDL-C, low-density lipoprotein cholesterol; OR, odds ratio.

a) Multivariate-adjusted for age, sex, Helicobacter pylori infection (H. pylori IgG positivity), body mass index (≥ 25.0 kg/m2), smoking status, and a family history of gastric cancer.

Table 5
Comparison of serum lipid levels between differentiated and undifferentiated gastric cancer groups
Total population Male group Female group


Differentiated Undifferentiated p-value Differentiated Undifferentiated p-value Differentiated Undifferentiated p-value
Total cholesterol 194 (176–216) 188 (169–217) 0.257 190 (169–213) 187 (168–213) 0.873 204 (189–220) 188 (169–220) < 0.001

HDL-C 46 (40–55) 51 (42–59) 0.148 44 (38–53) 47 (39–55) 0.504 54 (47–57) 55 (50–63) > 0.99

LDL-C 138 (119–155) 129 (111–154) 0.108 134 (118–154) 130 (114–153) 0.095 142 (125–159) 129 (108–155) 0.024

Triglyceride 108 (81–161) 92 (69–122) 0.001 109 (83–171) 98 (74–142) 0.013 102 (78–138) 83 (63–109) 0.329

Apolipoprotein A-I 135.9 (119.9–152.7) 142.3 (123.1–156.5) 0.690 132.8 (117.0–150.5) 135.0 (118.4–152.0) 0.265 145.5 (129.6–160.8) 147.6 (133.6–162.6) > 0.99

Apolipoprotein B 103.0 (87.9–115.0) 96.3 (82.3–113.0) 0.790 103.0 (88.6–115.0) 96.3 (84.8–114.0) 0.532 104.0 (87.8–115.0) 95.2 (77.6–111.0) > 0.99

Values are presented as median (interquartile range). HDL-C, high-density lipoprotein cholesterol; LDL-C, low-density lipoprotein cholesterol.

Table 6
Univariate and multivariate analyses for overall survival of gastric cancer
Univariate Multivariate


HR 95% CI p-value HR 95% CI p-value
Age 1.020 0.991–1.049 0.185 - - -

Sex 0.550 0.263–1.153 0.114 - - -

BMI 0.961 0.883–1.048 0.377 - - -

Smoking

 Never smoker > 0.99 0.080 > 0.99 0.003

 Former smoker 2.359 1.109–5.020 0.026 4.971 1.837–13.446 0.002

 Current smoker 1.669 0.796–3.501 0.175 4.283 1.660–11.050 0.003

H. pylori IgG positivity 0.596 0.304–1.168 0.132

Stage

 I > 0.99 > 0.99

 II 3.428 1.105–10.631 0.033 3.022 0.829–11.014 0.094

 III 4.930 1.936–12.551 0.001 3.298 1.117–9.738 0.031

 IV 222.411 80.806–612.169 < 0.001 376.884 100.982–1,406.604 < 0.001

Differentiation

 Differentiated > 0.99 -

 Undifferentiated 1.900 0.984–3.668 0.056 - - -

hsCRP 3.568 2.331–5.461 < 0.001 2.161 1.292–3.616 0.003

Total cholesterol 0.919 0.719–1.176 0.503 - - -

HDL-C ≥ 40 0.572 0.296–1.104 0.096 - - -

LDL-C

 < 100 > 0.99 -

 100–129 0.585 0.229–1.496 0.263 - - -

 130–159 0.412 0.152–1.115 0.081 - - -

 ≥ 160 0.558 0.194–1.610 0.281 - - -

Triglyceride 1.221 0.599–2.491 0.583 - - -

Apolipoprotein A-I 0.704 0.170–2.916 0.629 - - -

Apolipoprotein B 1.252 0.578–2.710 0.569 - - -

BMI, body mass index; CI, confidence interval; HDL-C, high-density lipoprotein cholesterol; HR, hazard ratio; hsCRP, high-sensitivity C-reactive protein; LDL-C, low-density lipoprotein cholesterol.

References

1. Bray F, Ferlay J, Soerjomataram I, Siegel RL, Torre LA, Jemal A. Global cancer statistics 2018: GLOBOCAN estimates of incidence and mortality worldwide for 36 cancers in 185 countries. CA Cancer J Clin. 2018;68:394–424.
crossref pmid
2. Karimi P, Islami F, Anandasabapathy S, Freedman ND, Kamangar F. Gastric cancer: descriptive epidemiology, risk factors, screening, and prevention. Cancer Epidemiol Biomarkers Prev. 2014;23:700–13.
crossref pmid pmc
3. Hashmi S, Wang Y, Suman DS, Parhar RS, Collison K, Conca W, et al. Human cancer: is it linked to dysfunctional lipid metabolism? Biochim Biophys Acta. 2015;1850:352–64.
crossref pmid
4. Asano K, Kubo M, Yonemoto K, Doi Y, Ninomiya T, Tanizaki Y, et al. Impact of serum total cholesterol on the incidence of gastric cancer in a population-based prospective study: the Hisayama study. Int J Cancer. 2008;122:909–14.
crossref pmid
5. Tornberg SA, Carstensen JM, Holm LE. Risk of stomach cancer in association with serum cholesterol and beta-lipoprotein. Acta Oncol. 1988;27:39–42.
crossref pmid
6. Huang YK, Kang WM, Ma ZQ, Liu YQ, Zhou L, Yu JC. Body mass index, serum total cholesterol, and risk of gastric high-grade dysplasia: a case-control study among Chinese adults. Medicine (Baltimore). 2016;95:e4730.
crossref pmid pmc
7. Knekt P, Reunanen A, Aromaa A, Heliovaara M, Hakulinen T, Hakama M. Serum cholesterol and risk of cancer in a cohort of 39,000 men and women. J Clin Epidemiol. 1988;41:519–30.
crossref pmid
8. Gong EJ, Ahn JY, Jung HY, Lim H, Choi KS, Lee JH, et al. Risk factors and clinical outcomes of gastric cancer identified by screening endoscopy: a case-control study. J Gastroenterol Hepatol. 2014;29:301–9.
crossref pmid
9. Nam SY, Park BJ, Nam JH, Kook MC. Effect of Helicobacter pylori eradication and high-density lipoprotein on the risk of de novo gastric cancer development. Gastrointest Endosc. 2019;90:448–56.
crossref pmid
10. Wulaningsih W, Garmo H, Holmberg L, Hammar N, Jungner I, Walldius G, et al. Serum lipids and the risk of gastrointestinal malignancies in the Swedish AMORIS study. J Cancer Epidemiol. 2012;2012:792034
crossref
11. Soran H, Schofield JD, Durrington PN. Antioxidant properties of HDL. Front Pharmacol. 2015;6:222.
crossref pmid pmc
12. Guo E, Chen L, Xie Q, Chen J, Tang Z, Wu Y. Serum HDL-C as a potential biomarker for nodal stages in gastric cancer. Ann Surg Oncol. 2007;14:2528–34.
crossref pmid
13. Laurila A, Bloigu A, Nayha S, Hassi J, Leinonen M, Saikku P. Association of Helicobacter pylori infection with elevated serum lipids. Atherosclerosis. 1999;142:207–10.
crossref pmid
14. Caruso MG, Notarnicola M, Cavallini A, Di Leo A. 3-Hydroxy-3-methylglutaryl coenzyme A reductase activity and low-density lipoprotein receptor expression in diffuse-type and intestinal-type human gastric cancer. J Gastroenterol. 2002;37:504–8.
crossref pmid
15. Kim HY. Metabolic syndrome is associated with gastric dysplasia. Eur J Gastroenterol Hepatol. 2011;23:871–5.
crossref pmid
16. Jung MK, Jeon SW, Cho CM, Tak WY, Kweon YO, Kim SK, et al. Hyperglycaemia, hypercholesterolaemia and the risk for developing gastric dysplasia. Dig Liver Dis. 2008;40:361–5.
crossref pmid
17. Bigler RD, Khoo M, Lund-Katz S, Scerbo L, Esfahani M. Identification of low density lipoprotein as a regulator of Fc receptor-mediated phagocytosis. Proc Natl Acad Sci U S A. 1990;87:4981–5.
crossref pmid pmc
18. Singh PP, Singh S. Statins are associated with reduced risk of gastric cancer: a systematic review and meta-analysis. Ann Oncol. 2013;24:1721–30.
crossref pmid
19. Borena W, Stocks T, Jonsson H, Strohmaier S, Nagel G, Bjorge T, et al. Serum triglycerides and cancer risk in the metabolic syndrome and cancer (Me-Can) collaborative study. Cancer Causes Control. 2011;22:291–9.
crossref pmid
20. Ulmer H, Borena W, Rapp K, Klenk J, Strasak A, Diem G, et al. Serum triglyceride concentrations and cancer risk in a large cohort study in Austria. Br J Cancer. 2009;101:1202–6.
crossref pmid pmc
21. Kim EH, Lee H, Chung H, Park JC, Shin SK, Lee SK, et al. Impact of metabolic syndrome on oncologic outcome after radical gastrectomy for gastric cancer. Clin Res Hepatol Gastroenterol. 2014;38:372–8.
crossref pmid
22. Iso H, Ikeda A, Inoue M, Sato S, Tsugane S. JPHC Study GroupSerum cholesterol levels in relation to the incidence of cancer: the JPHC study cohorts. Int J Cancer. 2009;125:2679–86.
crossref pmid
23. Novosyadlyy R, Lann DE, Vijayakumar A, Rowzee A, Lazzarino DA, Fierz Y, et al. Insulin-mediated acceleration of breast cancer development and progression in a nonobese model of type 2 diabetes. Cancer Res. 2010;70:741–51.
crossref pmid pmc
24. Balaban S, Lee LS, Schreuder M, Hoy AJ. Obesity and cancer progression: is there a role of fatty acid metabolism? Biomed Res Int. 2015;2015:274585
crossref
25. Sekine Y, Koike H, Nakano T, Nakajima K, Takahashi S, Suzuki K. Remnant lipoproteins induced proliferation of human prostate cancer cell, PC-3 but not LNCaP, via low density lipoprotein receptor. Cancer Epidemiol. 2009;33:16–23.
crossref pmid
26. Chen T, Wu F, Chen FM, Tian J, Qu S. Variations of very low-density lipoprotein receptor subtype expression in gastrointestinal adenocarcinoma cells with various differentiations. World J Gastroenterol. 2005;11:2817–21.
crossref pmid pmc
27. Li F, Du H, Li S, Liu J. The association between metabolic syndrome and gastric cancer in Chinese. Front Oncol. 2018;8:326.
crossref pmid pmc
28. Zheng H, Takahashi H, Murai Y, Cui Z, Nomoto K, Miwa S, et al. Pathobiological characteristics of intestinal and diffuse-type gastric carcinoma in Japan: an immunostaining study on the tissue microarray. J Clin Pathol. 2007;60:273–7.
crossref pmid pmc
29. Ma MZ, Yuan SQ, Chen YM, Zhou ZW. Preoperative apolipoprotein B/apolipoprotein A1 ratio: a novel prognostic factor for gastric cancer. Onco Targets Ther. 2018;11:2169–76.
crossref pmid pmc
30. Tamura T, Inagawa S, Hisakura K, Enomoto T, Ohkohchi N. Evaluation of serum high-density lipoprotein cholesterol levels as a prognostic factor in gastric cancer patients. J Gastroenterol Hepatol. 2012;27:1635–40.
crossref pmid
Editorial Office
Korean Cancer Association
Room 1824, Gwanghwamun Officia
92 Saemunan-ro, Jongno-gu, Seoul 03186, Korea
TEL: +82-2-3276-2410   FAX: +82-2-792-1410   E-mail: journal@cancer.or.kr
About |  Browse Articles |  Current Issue |  For Authors and Reviewers
Copyright © Korean Cancer Association.                 Developed in M2PI