Introduction
Colorectal cancer (CRC) is the second most common cancer and also the fourth most frequent cause of cancer death worldwide [1]. However, its incidence and mortality has decreased primarily due to screening. Biennial fecal occult blood test (FOBT) reduces CRC-specific mortality by 9%-22%, flexible sigmoidoscopy can decrease it by 27% [2], and colonoscopy can further reduce mortality up to 68% [3]. Based on such evidence, CRC screening is recommended for people aged 50 years or older by FOBT or other more invasive modalities.
Ensuring high participation among socially or medically disadvantaged groups is important not only to improve equality, but also to maximize the benefit of the screening program. Studies investigating whether people with disabilities receive CRC screening at rates equivalent to people without disability produced mixed results: some studies showed lower participation rates [4], some showed no differences [5,6], and others reported even higher rate [7,8].
Given the unique barriers experienced by people with different types of disabilities, adherence to CRC screening would be expected to vary by disability type [4,9]. It is also unclear what level of severity of disability actually impedes cancer screening. The various barriers according to different types and severity of disabilities have important implications in designing tailored intervention to improve CRC screening participation rates. However, many studies have defined disability broadly [6], and data comparing CRC screening participation rates between different types and severity of disabilities are scarce and often underpowered [4,8].
Methodologically, most previous studies used survey data and had the following limitations: (1) many showed a low response rate (e.g., 37.7% [5]) and were prone to bias due to exclusion of people with more severe disabilities; (2) reliance on self-reporting of difficulties performing various functions for the definition of disability type and severity, which is not as objective as clinical assessment [4,5,8]; (3) use of selfreporting for CRC screening practice, which is prone to recall bias [7,8] and may not discriminate between tests performed for screening purpose and those performed for diagnostic testing [7]; (4) data were underpowered for comparison of CRC screening participation rates across various disability types and severity [4,5,8].
A few studies have used claims data [9,10]. However, these were limited as they defined disability only by disease codes and did not include the severity of functional impairment [9], or included only specific types of disabilities (e.g., visual, intellectual, and spinal cord injury [9] or intellectual and developmental disabilities [10]). One study included only selected populations, i.e., beneficiaries of Medicaid and Medicare, and excluded those who were insured by private insurance or uninsured [9]. Other study was limited by the inability to discriminate screening tests from diagnostic tests and the lack of important sociodemographic variables in the data source [10].
In Korea, all people are covered by universal health insurance regardless of income level or health risk, and CRC screening is provided at no or minimal cost by the national program, minimizing the influence of financial barriers. In addition, the national disability registration system defines the type and severity of disabilities based on medical examination and specific criteria. This system provides unique opportunities to investigate the impact of various types of disabilities and their severity on CRC screening [11].
Therefore, in this study we used nationwide health claims data to investigate (1) whether CRC screening practices differ by the presence of disability and according to various types and severity of disability, (2) the trend of CRC screening participation rate in relation to disabilities over time; and (3) the factors associated with adherence to CRC screening.
Materials and Methods
1. Study setting and data source
1) Korean National Health Insurance Service
The Korean National Health Insurance Service (NHIS) is the single insurer providing universal health insurance that covers virtually all of the Korean population. Medical aid beneficiaries in the lowest income bracket (approximately 3% of the population) are covered by government funding.
2) National CRC Screening Program in Korea
In Korea, the National Cancer Screening Program (NCSP) was launched in 1999 [12], and currently includes screening for stomach, liver, colorectal, breast, and cervical cancer. Since 2005, cancer screening has been provided free for Medical Aid recipients and National Health Insurance (NHI) beneficiaries in the lower half of the income stratum. NHI beneficiaries in the upper half of income level receive cancer screening with 10% copay of the screening cost, which is usually regarded the minimal cost for this population (S1 Table).
CRC screening is indicated for individuals aged 50 years and older, primarily via annual FOBT as the primary modality. People with positive results from the FOBT are entitled to either colonoscopy or a barium enema test [13,14]. This screening was provided biennially until 2011, and then annually from 2012.
Korean NHIS sends an invitation letter to all men and women eligible for each cancer screening program according to the NCSP protocol with information on screening methods and nearby locations of NCSP providers for each individual [15]. NCSP is mostly operated by private providers and is reimbursed by the Korean NHIS; therefore, Korean NHIS includes information on national cancer screening, such as screening eligibility for each year, whether the eligible subjects participated in the screening program, and the date of participation.
As the focus of our study was the first stage FOBT, we defined CRC screening participation rate as the number of people who participated in FOBT screening divided by the number of people eligible for FOBT screening for each year. We did not report participation rates for secondary screening (i.e., colonoscopy/barium enema test), as previous studies showed that many people who receive a positive FOBT test opt for further testing through medical care, not by NCSP [16].
3) Disability registration system in Korea
In 1988, the Korean government established a national registration system for people with disabilities primarily for the provision of welfare benefit, which is determined by the type and severity of disability [11]. For a person to register as disabled they must submit documents, including appraised results for disability and their diagnosis, to a local National Pension Service office and go through the validation process.
There are 15 legally defined disability types (for details, see Tables). Severity of the disability is determined by a specialist physician in the corresponding field according to government guidelines based on the functional losses and clinical impairment presented by the patient and is classified into six levels.
2. Data source and study subjects
The data used in this study were from the National Health Information Database (NHID) from 2006 to 2015. NHID is a public database on health care utilization, health screening, socio-demographic variables, and mortality for the whole population of South Korea, a population of over 50 million. The NHID provides an excellent platform for various epidemiological and health policy studies [11,17,18]. Details of the database profile are described elsewhere [19,20].
As there were some changes in the coverage and copayments in NCSP during its early implementation phase (2001-2005), we have limited our analyses of CRC screening variables to the period from 2006-2015 for consistency.
3. Statistical analyses
Age, sex-standardized participation rates were calculated on a single-year basis between the years of 2006 and 2015 using the 2010 Census of the Korean population, according to the presence, type, and severity of disability. The change of CRC screening interval of NCSP in 2012 (i.e., biennial to annual) resulted in abrupt decrease in the participation rate, which was defined as the number of participants divided by eligible population in that year.
To examine factors associated with receipt of CRC screening, we conducted a series of multivariate logistic regressions including variables on disability (presence, severity, type), and other sociodemographic variables including age, sex, income level (4 ranks and Medicaid), place of residence (metropolitan, city, and rural), and calendar year. We also examined potential interactions between disability status and regional characteristics.
All analyses were performed using the SAS ver. 9.4 (SAS Institute Inc., Cary, NC), and p-values of < 0.05 were considered statistically significant.
Results
1. Study participants
1) Trends in CRC screening participation rates according to disability
The number of eligible and screened people and the crude and age, sex-standardized participation rates are described in Table 1 and S2 Table. The number of eligible people invited to undergo CRC screening increased from 5.6 million in 2006 to 14.7 million in 2015.
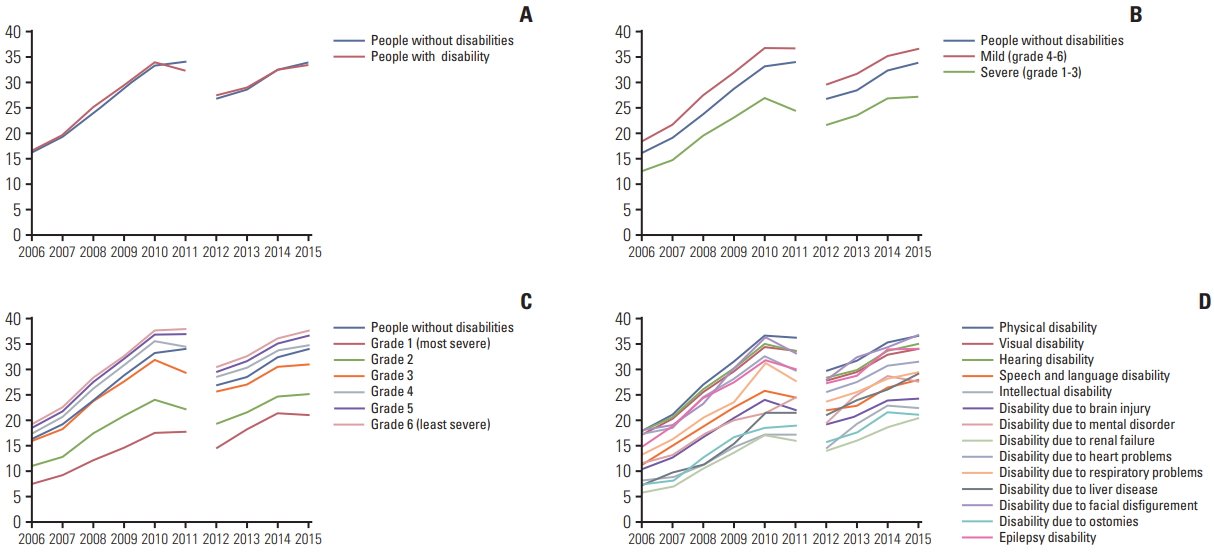
The trends in participation rates in CRC cancer screening via the NCSP from 2006 to 2015 are shown in Fig. 1. The age, sex-standardized participation rate for CRC among people with disability increased from 16.5% in 2006 to 33.4% in 2015 (change, +16.9 percentage points [pp]), whereas the rate among people without disability increased from 16.2% to 33.9% (change, +17.7 pp).
In analysis by disability severity, people with mild disability showed a marked increase in rate of screening (from 18.5% to 36.6%; change, +18.1 pp) whereas people with severe disability showed a modest increase (from 12.7% to 27.2%; change, +14.5 pp). Specifically, people with grade 1 disability showed the lowest increase (from 7.4% to 20.9%; change, +13.5 pp), while people with grade 6 disability showed the greatest increase (from 19.1% to 37.6%; change, +18.5 pp).
Among various disability types, the highest participation rates as well as the largest increases were observed in people with disabilities due to epilepsy (from 14.9% to 34.2%; change, +19.3 pp), facial disfigurement (from 22.2% to 50.3%; change, +28.1 pp), and physical disability (from 18.0% to 36.7%; change, +18.7 pp). The lowest participation rates as well as the smallest increases were observed in people with disability due to ostomies (7.3% to 21.1%; change, +13.8 pp), renal failure (5.7% to 20.4%; change, +14.7 pp), intellectual disability (from 8.1% to 22.4%; change, +14.3 pp), and disability due to brain injury (10.5% to 24.3%; change, +13.8 pp) (S2 Table).
2) Factors associated with CRC screening
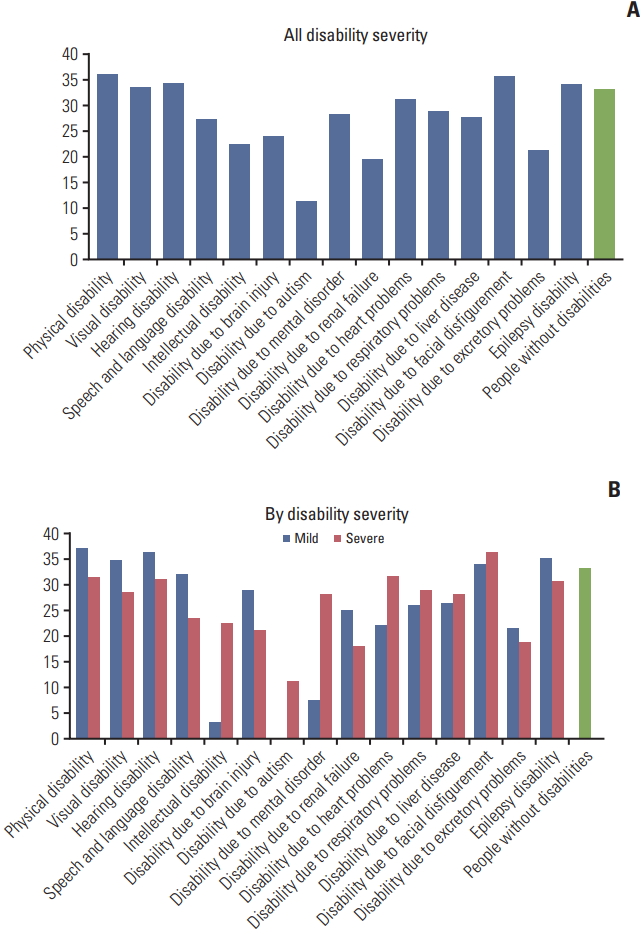
Age, sex-standardized rates for CRC cancer screening by disability types and grade in recent years (2014-2015) are displayed in Fig. 2. Patterns were different across the various disability types; overall, people with physical or facial disfigurement and epilepsy-related disabilities showed higher participation rates than those with disabilities associated with brain injury, intellectual disabilities, renal failure, or ostomies.
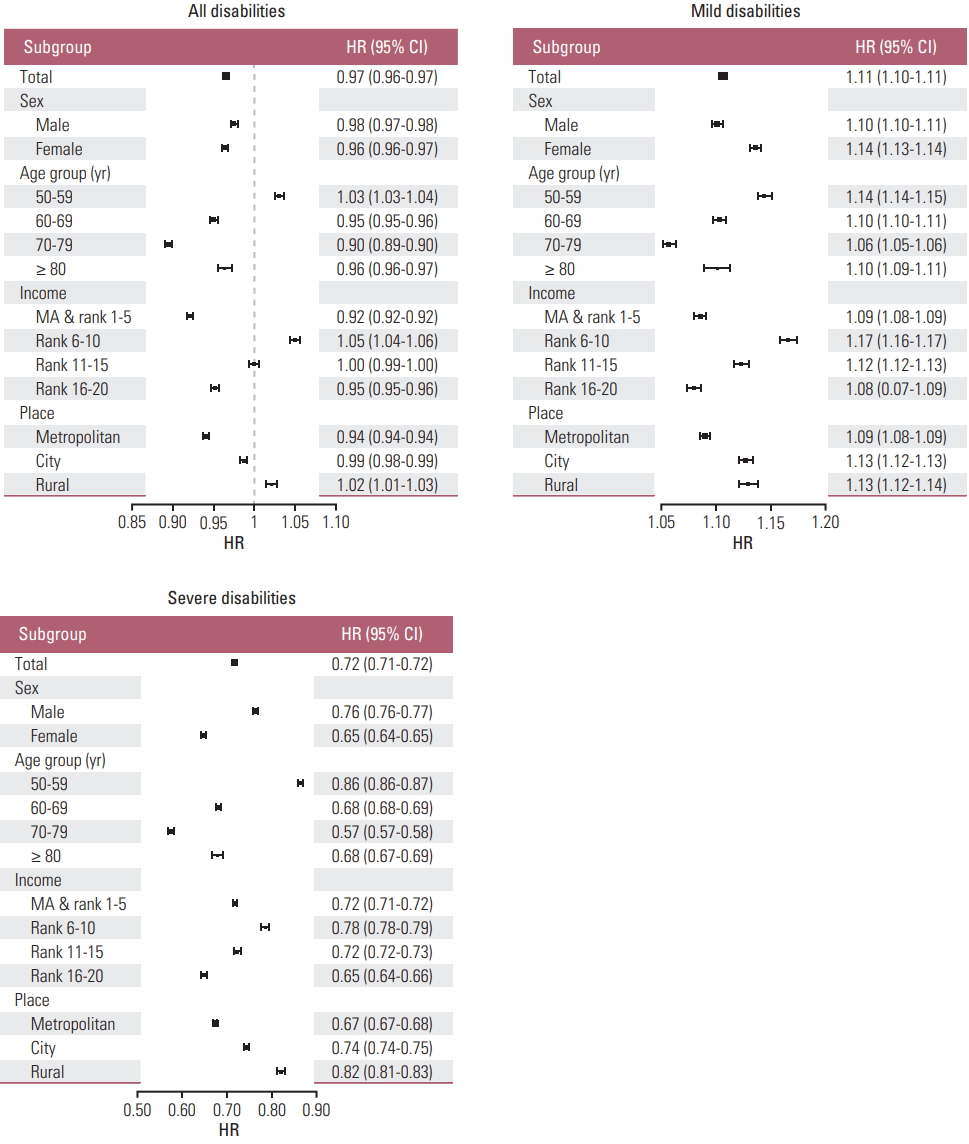
In multivariate logistic analyses, presence and absence of a disability were associated with almost the same participation rates (adjusted odds ratio [aOR], 0.966; 95% confidence interval [CI], 0.964 to 0.969). However, people with severe disabilities showed a markedly lower participation rate than people without disability (aOR, 0.714; 95% CI, 0.713 to 0.720), while people with mild disabilities showed higher participation rates than people without disability (aOR, 1.107; 95% CI, 1.103 to 1.110).
People with autism (aOR, 0.468; 95% CI, 0.242 to 0.905), renal failure (aOR, 0.498; 95% CI, 0.489 to 0.506), brain injury (aOR, 0.581; 95% CI, 0.576 to 0.586), ostomies (aOR, 0.602; 95% CI, 0.583 to 0.623), and intellectual disability (aOR, 0.610; 95% CI, 0.599 to 0.621) showed the lowest probability of receiving CRC screening. In contrast, higher participation rates were observed in people with facial disfigurement (aOR, 1.131; 95% CI, 1.041 to 1.229), physical disabilities (aOR 1.125, 95% CI 1.121 to 1.129), and epilepsy disability (aOR, 1.109; 95% CI, 1.053 to 1.169).
Increasing age, highest income, and metropolitan residence were associated with lower CRC screening participation rates, while mid-income was associated with higher participation rates (Table 2). There was a significant interaction between disability status and regional characteristics: people with disabilities in metropolitan areas were less likely to participate in CRC screening than those residing in rural areas, regardless of disability severity (Fig. 3).
Discussion
Using national data of an unprecedented scale, we were able to show disparities of CRC screening participation rate according to various types and severity of disabilities. In addition, because we used population-based screening data rather than self-reporting the receipt and timing of the screening service are clear, and therefore we could avoid the limitations of recall bias and over-reporting [9,10].
Overall, there seemed to be no difference in CRC screening participation rates between people with disabilities and those without disability. However, when examined more in detail, our data revealed that the pattern of disparities significantly differed according to the severity of disabilities; people with less severe disabilities were more likely to receive CRC screening than people without disabilities, while people with more severe disabilities showed lower participation rates than the comparison population. Some previous studies reported higher participation rates in people with disabilities, and called this finding ‘paradoxical’ [7,8]. Increased contact with primary care physicians for management of comorbid health problems was suggested as a potential explanation for higher participation rates in people with disabilities. However, with increasing severity of disabilities the participation rates significantly decreased. Previous studies suggested various reasons for lower participation in cancer screening, such as competing health priorities, lack of knowledge and awareness of recommendations, difficulty in understanding the value of screening, language barriers, and physical access barriers [8,9].
CRC screening participation rates increased steadily during the study period across all types and severity grades of disabilities. However, the gaps in participation rates increased in relation to the severity of disability. This is in contrast to previous findings that the gaps in CRC screening participation rates have recently decreased among age groups and income status suggesting positive effects of NCSP in reducing the inequity regarding cancer screening in Korea [15].
As expected, adherence to CRC screening varied by disability type. The lowest adherence was observed in people with disability due to brain injury. The most common medical problem in this type of disability is stroke, which is often characterized by hemiplegia and results in mobility and healthcare access problems and difficulty in collecting the stool specimen. Similarly, people with spinal cord injury showed a lower participation rate in a previous study [9]. Disability due to autism and intellectual disability were among other types of disability showing the lowest adherence. These groups are characterized by cognitive limitations, which might result in difficulty comprehending the necessity of screening. This is consistent with a Canadian study that showed 30%-50% lower CRC screening participation rates in people with intellectual and developmental disabilities [10]. U.S. studies also showed lower adherence in people with intellectual disability [9] or cognitive disabilities [4].
It is not clear why people with renal failure are receiving less CRC screening. One possibility is that patients who are registered in the Korean disability registration system are usually those with end-stage renal disease on repeated dialysis, and they or their physician might have perceived their life expectancy as too short to benefit from preventive cancer screening. Currently, experts do not recommend CRC screening for most dialysis patients due to poor expected survival and concerns about potential overscreening in this population [21].
People with ostomy-related disabilities also showed lower rates of CRC screening. Major causes of permanent ostomies are CRC and ulcerative colitis, although there are other causes such as bladder cancer. Patients with CRC and ulcerative colitis would be regularly followed up with more advanced modalities, and therefore might have not participated in FOBT screening.
In contrast, people with limb disabilities (e.g., amputees), visual disability, hearing disability, disabilities due to heart, respiratory, or liver problems, and epilepsy did not show suboptimal adherence compared to people without disabilities. Previous U.S. studies showed lower adherence with visual disability [4,9], and suggested cost of care, availability of insurance coverage, and problems with transportation as potential barriers. The differences between the two countries lie in the absence of problems with insurance coverage or screening cost in Korea as noted above, as well as a well-developed public transportation system in a densely populated country where people do not need to drive a car to access the screening unit. However, it should be noted that people with these types of disabilities also showed a lower CRC screening participation rate when their disability was severe, again implying that a certain degree of disability can negatively affect cancer screening behavior in this population.
One interesting finding was an interaction between disability status and regional characteristics. People with disabilities in rural areas were more likely to participate than those in metropolitan areas. One possible reason could be mobile screening units in remote city and rural areas, which enhance access, especially for people with disabilities [22]. Therefore, outreach programs can be an effective intervention to increase CRC participation for people with disabilities living in remote city or rural areas who have limited transportation [23,24].
Our finding has several policy implications. First, the increasing gap by disability suggests that the current national cancer screening system has ignored this disparity issue and was not well prepared to respond to the special needs of this growing and diverse population. Similar finding was noted in our previous study of cervical cancer screening participation in relation to disability [11]. These results imply that implementation of cancer screening program may lead to increased health disparity within the population if participation differs by socioeconomic status [25]. More research and effort are needed to develop policy actions to decrease this unjustified gap. Second, the difference in participation in CRC screening among people with varying severity and types of disabilities suggests the need for further studies addressing the unique barriers of each disability group. Qualitative studies would be particularly useful to identify these largely unknown issues and develop appropriate interventions tailored for each specific group. Some individuals will need increased access to the program through support for transportation to the screening facilities, or direct mailing of the FOBT [26]. Others will need simpler collection methods such as fecal immunochemical tests [10], and interventions to improve attitudes, knowledge, and caregiver skills would be beneficial for some groups [10].
Having a usual source of care was consistently reported to be associated with higher screening participation among people with disabilities [7,8,10]. People with disabilities often have multiple demands that compete for the attention of physicians and patients, and their preventive care needs can be unintentionally overlooked and not well-coordinated even though they have multiple providers [27]. In Canada, people with intellectual and developmental disabilities who were enrolled in a primary care patient enrolment model participated more in CRC screening because physicians in such models have greater financial incentives to conduct CRC screening than physicians who practice under the traditional fee-for-service model [10]. In Korea, people are free to visit any physician and there is no population health management system requiring primary care physicians to cover a certain amount of the population proactively. However, to acknowledge the complex needs of people with disabilities a demonstration project to assign a primary care physician to people with severe disability is currently ongoing.
Our study has several limitations. First, we did not consider opportunistic screening, which is commonly practiced by private screening or clinical encounter and mostly via sigmoidoscopy or colonoscopy. In Korea, private health screenings are widely available and often used by people with high socioeconomic status (around 7.5% of Korean adults) [28]. Assuming that people with disabilities who are socio-economically disadvantaged are less likely to participate in the private health screening program and would avoid the bowel preparation required before other procedures [8], the disparities in our study could be considered to be underestimated. Second, our study was not designed to explore the barriers to and facilitators of CRC screening among persons with disabilities. More in-depth research is needed to identify specific causes of observed disparities and to develop tailored interventions to reduce the identified barriers for specific disability groups. Third, we did not exclude people who had ostomies caused by colon cancer, who were not targets for cancer screening, from the eligible population. Currently, Korean NHIS does not have algorithms to exclude this group and count them as an eligible population. In addition, it was impossible to distinguish them from people with urostomy or people who received colostomy due to other causes in the disability registration or medical claims databases. However, this population comprises only < 0.7% of people with disabilities, and would not significantly affect the overall results. Fourth, the disability registration system in Korea is unique and should be considered in the interpretation of our findings and for comparison with previous studies from other countries. For example, the disability rate in the Korean population is 4% compared to 15% according to World Health Organization standards. In addition, the disability rate in the CRC screening eligible population was 10.5% in our study, compared to around 30% in a U.S. study [8]. This is due to the strict criteria for disability registration in Korea, although WHO defines disability in the broader concept of functioning and contextual factors [29]. However, use of objectively assessed disability types and severity also has strengths for understanding the differential impact of each disability type and severity on CRC screening participation. Fifth, we did not report participation rate for secondary screening with colonoscopy/barium enema, although receipt of confirmatory test is important in subject with FOBT positive result. As described above, many people receive confirmatory test through medical care, not by NCSP, and there is currently no adequate method to assess the participation rate of confirmatory colonoscopy test. Lastly, our findings must be understood within the context of the current Korean healthcare and system. Nonetheless, our data provide valuable information for other countries that are promoting universal health coverage and routine preventive services.
In summary, despite the availability of an NCSP and overall increase in its usage among the Korean population, a significant disparity was found in CRC screening participation, especially in people with severe disabilities and people with several specific types of disabilities. Greater effort is needed to identify the barriers faced by these particularly vulnerable groups and develop targeted interventions aimed at making CRC screening more equitable.