Introduction
Among types of head and neck squamous cell carcinoma (HNSCC), nasopharyngeal carcinoma (NPC) is the most common and is highly prevalent in Southeast Asia and Southern China [1]. The majority of NPC was found to be non-keratinizing in endemic regions [2] and was highly sensitive to irradiation and chemotherapeutic drugs. The primary treatment regimen for NPCs is radiotherapy (RT) coupled with or without chemotherapy. However, there are limited effective non-invasive image modalities for the early prediction of tumor response to chemoradiotherapy (CRT).
Intensity-modulated radiation therapy (IMRT) for NPC has been reported to provide satisfactory outcomes compared to other RT techniques [3,4]. For advanced diseases, CRT shows a better prognosis than RT alone, especially sequential CRT and concurrent chemoradiotherapy (CCRT) [5-7]. In particular, studies reported higher survival rates in patients undergoing CCRT than sequential CRT [6,7]. Notably, radio-resistance, tumor recurrence, and the development of distant metastases remain the contributing reasons for treatment failure. In this regard, an optimal imaging regimen is critical for early assessment of radiosensitivity of tumor. A valid imaging modality was explored to assess the treatment responses of NPCs.
Routine magnetic resonance imaging (MRI) currently provides a better soft tissue contrast and spatial resolution in evaluating the extent of primary nasopharynx tumor and positive cervical nodes and also plays a conventional role in assessing tumor’s response to CRT. However, morphological images only reveal macroscopic changes in tumor size that may not be apparent, and the initial treatment and characterization of immediate therapeutic effects could be limited. Recent studies primarily focused on the functional treatment response of tumors by various MRI techniques. For instance, diffusion-weight imaging (DWI) measures and characterizes the thermal motion of water molecules. In particular, the apparent diffusion coefficient (ADC) has been validated as a potential imaging biomarker to identify tumor treatment response [8]. However, ADC is calculated based on a monoexponential model that reflects the combined effects of diffusion and perfusion [9].
In contrast, intravoxel incoherent motion (IVIM), which was initially described by Le Bihan et al. in 1986 [9], is a bi-exponential model to separately quantify tissue diffusion and perfusion [10]. In recent decades, IVIM-DWI has gained attentions due to its effective diagnostic capability in tumors, including those of the head and neck [11,12]. Moreover, IVIM parametrics have been correlated with clinical staging [13] as well as the treatment response of HNSCC [14,15]. Our previous study validated the potential value of IVIM-DWI in predicting the early treatment response of neoadjuvant chemotherapy (NAC) in local to regionally advanced NPCs [16]. Nevertheless, the assessment of IVIM-DWI regarding the radio-sensitivity of NPCs is yet to be explored. Since early prediction of treatment response through IVIM-DWI might arise significant impacts on patient-care planning and treatment regimens, the objective of this study is to evaluate the clinical value of IVIM-DWI in predicting the treatment response to IMRT in NPCs.
Materials and Methods
1. Patients and treatment
1) Patient enrollment
A cohort of 64 consecutive NPC patients was enrolled between May 2015 and August 2016. The inclusion criteria were as follows: (1) histopathological diagnosis of NPC, (2) no pregnancy, (3) no contraindications for magnetic resonance (MR) scanning, (4) no allergies to contrast agents of gadolinium (Gd), (5) a treatment plan of IMRT with or without chemotherapy, and (6) complete acquisition of all followup IVIM-DWI.
Forty-seven subjects who met the above criteria were included. The remaining 17 cases were excluded from this study for the following reasons: three due to the severe distortion and artifacts of images, 10 failed to complete all follow-up IVIM-DWI, and four missed the MR examination after CRT. Four NPC were classified as pathological type World Health Organization (WHO) II, and the remaining 43 were WHO III. According to the staging criteria of NPC of The American Joint Committee on Cancer [17], one, eight, 20, and 18 cases were staged I, II, III, and IV, respectively. Table 1 summarized the clinical characteristics of the recruited patients.
2) Treatment regimens
All recruited patients were treated with definitive IMRT with or without chemotherapy. The detailed description of IMRT has been published previously [18]. The primary NPC tumor and its surrounding invasive regions were defined as gross target volume-tumor (GTV-T), the GTV-T–planning target volume (PTV) (95%V) exposure dose was 6,600-7,425 cGy/30-33 fractions (period, 6-7 weeks), and the fractional irradiation dose was 225 cGy. The surrounding region of 5-10 mm beyond GTV-T was established as clinical target volume (CTV) 1, and the CTV1-PTV (95%V) exposure dose was 6,000-6,270 cGy/30-33 fractions (period, 6-7 weeks), and the fractional dose was of 190-200 cGy. However, the region of the suspected and positive cervical nodes were identified as CTV2, and the CTV2-PTV (95%V) exposure dose was 5,400-5,610 cGy/30-33 fractions (period, 6-7 weeks); the fractional irradiation dose was of 170-180 cGy.
A total of 41 cases (87.23%) also received the platinumbased chemotherapy. The detailed regimens of chemotherapy were as follows (Table 1): 35 cases (74.46%) of NAC, including 26 cases of cisplatin plus Taxol and nine cases of cisplatin plus gemcitabine; six cases (12.77%) of CCRT by applying cisplatin alone (from day 1 to 3 in 21-day cycles); the remaining six cases received RT alone. Patients with persistent or recurrent tumors after completing the initial treatments (IMRT alone or CRT) received salvage treatments (including intracavitary brachytherapy, surgery, and/ or further adjuvant chemotherapy, etc.) when possible.
2. MRI protocols
1) Conventional MRI
Before initial treatments, head and neck MRI from the lower temporal lobe to the supraclavicular region were performed on a 3.0T MR system (Achieva, Philips Healthcare, Best, Netherlands). Conventional MRI protocols including these following sequences: (1) axial T1-weighted imagingturbo spin-echo (T1WI-TSE): repetition time/echo time (TR/TE), 550/8.1 msec; field of view (FOV), 23 cm×23 cm; reconstruction matrix, 960×960; slice number, 36; thickness, 5 mm; gap, 1 mm; (2) axial T2-weighted imaging with short TI inversion recovery (T2WI-STIR): TR/TE, 6,888/70 msec; FOV, 23 cm×23 cm; matrix, 960×960; slice, 18; thickness, 5 mm; gap, 1 mm; (3) coronal T2WI-STIR: TR/TE, 2,327/63 msec; FOV, 23 cm×23 cm; matrix, 672×672; thickness, 5 mm; gap, 1 mm; (4) sagittal T1WI-TSE: TR/TE, 600/8.1 msec; FOV, 23 cm×23 cm; matrix, 768×768; thickness, 5 mm; gap, 1 mm; and (5) postcontrast-enhanced secquences of axial, sagittal, and coronal T1WI-TSE with spectral presaturation inversion recovery: TR/TE, 1,215/8.1 msec; flip angle, 90°; FOV, 23 cm×23 cm; matri, 960×960; thickness, 5 mm; gap, 1 mm. The total scan time was approximately 12 minutes. The detailed parameters of conventional MR sequences were published previously [16].
2) IVIM-DWI
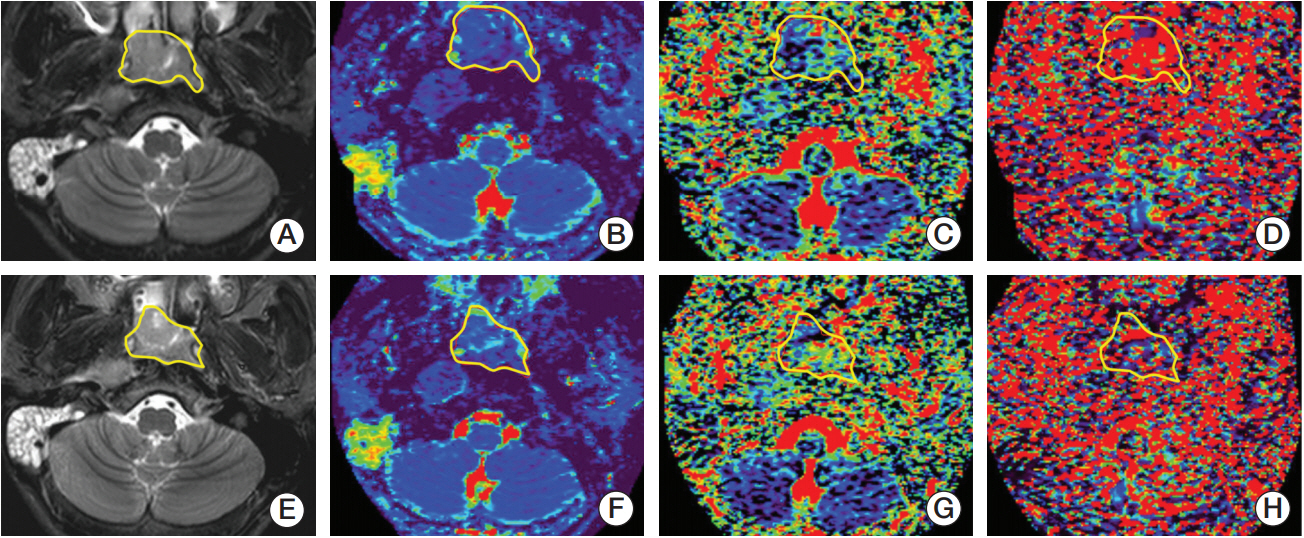
IVIM-DWI was performed following conventional MRI before radiation and repeatedly at the end of the fifth, 10th, 15th, 20th and 25th fraction of radiations, as well as at the end of IMRT, accompanied by an axial T2-weighted imaging sequence. A single-shot spin-echo echo-planar imaging with 14 b-values (0, 10, 20, 30, 40, 50, 100, 150, 200, 350, 500, 600, 800, and 1,000 sec/mm2) DWI sequence were acquired with other parameters as follows: TR/TE, 4,495/69 msec; inversion recovery delay, 240 msec; FOV, 23 cm×23 cm; number of signals averaged, 4; matrix, 256×256; thickness, 5 mm; gap, 1 mm; number of slices, 24; three orthogonal diffusion gradients (x, y, z) were turned on simultaneously; scan time, 8 min. The same post-processing of IVIM- DWI has previously been performed [16]. Two experienced radiologists with more than 10-year experience in head and neck MRI conducted the measurement of IVIM parametrics (D, f, and D*) independently, twice, with a double-blind control, in order to minimize the interobserver variability. IVIM parametrics were calculated by using the software termed interactive data language (IDL) (ver. 6.3, ITT Visual Information Solutions, Boulder, Chicago, IL). The regions of interest (ROIs) were firstly contoured manually along the widest cross-section of target lesions on T2WI-STIR image slice, and then subsequently copied and coregistered automatically to IVIM parametric images for analysis with the IDL 6.3 software. The ROI covered at least 2/3 of the area of the target lesions, avoiding the areas of necrosis and adjacent structures (i.e., bone, air, muscles, etc.). IVIM parametrics (D, D*, and f) were extracted using the ROIs defined above.
The formula of the relation between D, D*, and f directly was as follows (Eq. 1):
In which D represents the pure diffusion of water molecules in extracellular space, D* represents the perfusionrelated diffusion of water molecules in capillary network microcirculation, and f represents the fraction of perfusionrelated diffusion.
The baseline D before radiation was noted as D0, the D from the subsequent Xth fraction was noted as DX and the end of radiation was Dend. The corresponding changes in D (ΔDX) were calculated using the following equation (Eq. 2):
The relative rates of changes in DX were defined as δDX with the following equation (Eq. 3):
The parametrics of D* and f followed the same nomenclature as that employed for D.
3. Evaluation of treatment response
At the end of IMRT and 3 months after all prescriptions of CRT, patients received a routine MRI examination to evaluate the short-term treatment outcomes. Based on the followup MRI data and clinical evaluations, patients were classified into responders and non-responders according to the WHO response evaluation criteria in solid tumors [19]. Patients were categorized as responders when all assessable tumors completely disappeared for no less than 4 weeks (complete response [CR]) or when tumor volume (i.e., the longest diameter multiplied by its vertical lengths) decreased by more than 50% for no less than 4 weeks (partial response [PR]). Patients were identified as non-responders if their original tumors showed a < 50% reduction or < 25% increase in tumor volume without any appearance of new lesions (stable disease [SD]) or showed a > 25% increase in tumor volume and/or appearance of new lesions (progressed diseases [PD]).
4. Statistical analyses
The reproducibility of measuring IVIM parametrics was tested by an intra-class correlation coefficient (ICC). One-way ANOVA was applied to analyze the general changes in IVIM parametrics after RT. Student’s t-test or the Mann-Whitney U test were conducted to compare parametrics between groups. The receiver operating characteristic (ROC) curve analysis was employed to estimate the diagnostic capability, which was determined by the area under the curve (AUC). All statistical analyses were performed with SPSS ver. 18.0 (SPSS Inc., Chicago, IL).
Results
1. The reproducibility of the measurement on IVIM parametrics
The mean value of IVIM parametrics measured by two independent radiologists were treated as the final results of this present study. And the mean value of IVIM parametrics acquired from all recruited patients at the set time points throughout IMRT are shown in Table 2. The overall distribution of D, D*, and f values were consistent with a normal distribution (p > 0.1). The inter- and intra-observer ICCs of measurements were for D (0.977 vs. 0.987), f (0.947 vs. 0.964), and D* (0.883 vs. 0.926); and their corresponding coefficient variations were for D (8.54% vs. 5.83%), f (16.22% vs. 10.60%), and D* (28.69% vs. 19.51%), respectively.
2. IMRT treatment positively influenced IVIM parametrics
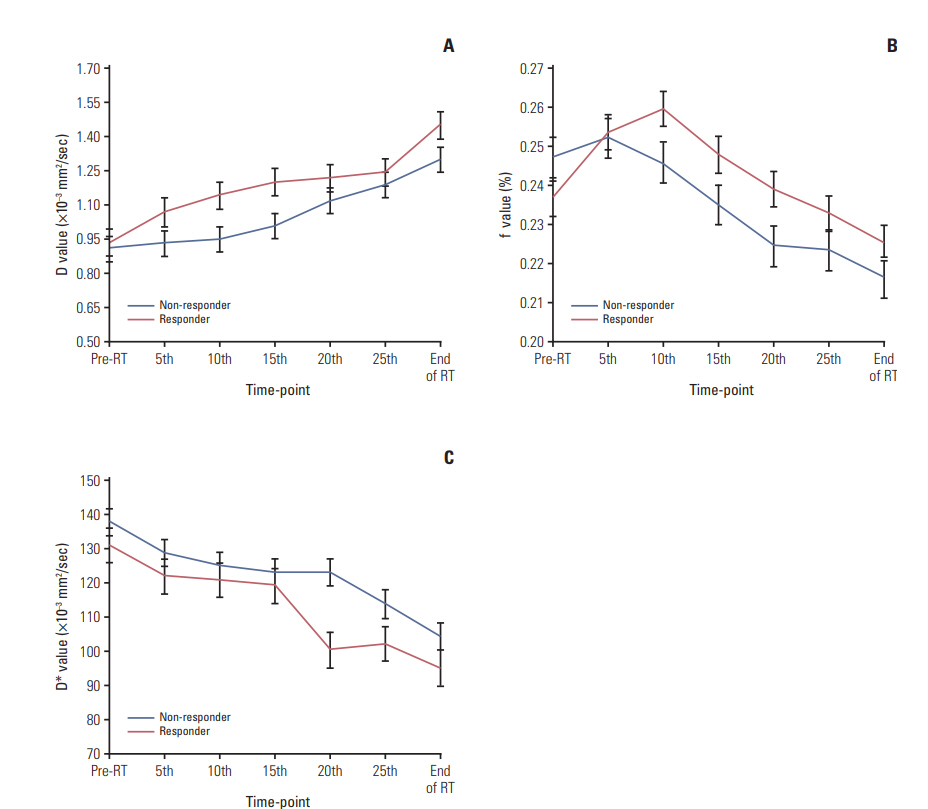
The general changes in D, f, and D* after IMRT were statistically significant (p < 0.001 for all) (Fig. 1). D were significantly higher after radiations (except D5; p=0.302) than the baseline D0 (p < 0.05), whereas the D* increased significantly compared to D*0 (p < 0.05), except for D*5 (p=0.211) and D*10 (p=0.064). Moreover, f5 and f10were significantly higher compared to f0 (p < 0.05), whereas fendwas found to be lower than f0 (p < 0.05).
3. IVIM parametrics between responders and non-responders
Based on post-treatment assessment, there were 37 responders (78.72%) and 10 non-responders (21.28%). In particular, 27 cases of CR, 10 cases of PR, nine cases of SD, and one PD were found. The IVIM parametrics of responders and nonresponders coupled with their corresponding changes and rates at each time point of IMRT were summarized and compared in Table 3.
Responders presented significantly larger D5, D10, and D15 than non-responders (p=0.008, p=0.003, and p=0.002, respectively). Additionally, the parametrics of f0, D*20, and D*25 were significantly larger in responders compared to nonresponders (p=0.019, p < 0.001, and p=0.006, respectively), whereas the f10 of responders was significantly smaller than that for non-responders (p=0.008). Furthermore, significantly larger ΔD10 (p=0.036), Δf10 (p=0.035), ΔD*20 (p=0.048), and δD*20 (p=0.041) were also observed in responders relative to non-responders (Figs. 2 and 3).
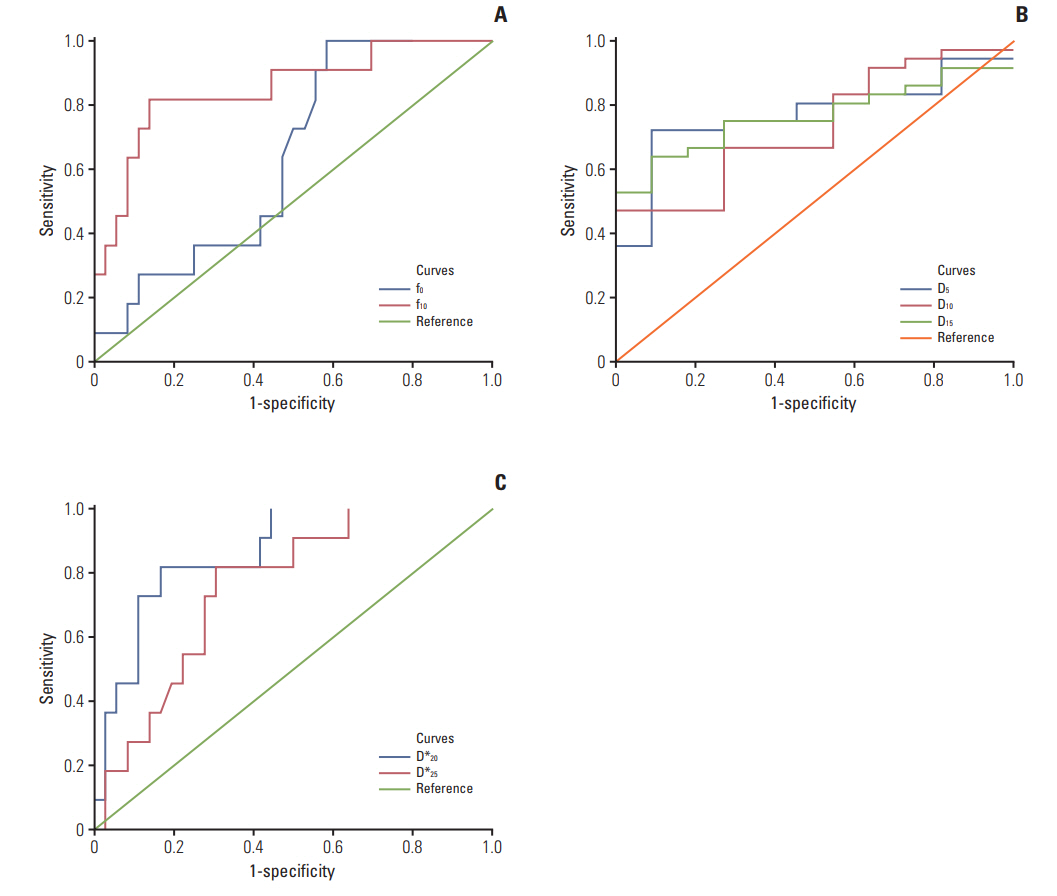
4. The diagnostic capability of IVIM parametrics in differentiating treatment responses
The ROC curve analysis showed that D5, D10, D15, f0, f10, D*20, and D*25 coupled with ΔD10, Δf10, ΔD*20, and δD*20 could effectively differentiate the treatment responses of IMRT (all p < 0.05) (Table 4, Fig. 4) because these parametric values were larger in responders than non-responders (all p < 0.05). In particular, D5, D*20, and f10 differentiated responders from non-responders with their AUC, sensitivity, and specificity values of 0.773, 72.2%, 90.9%; 0.851, 81.8%, 86.1%, and 0.864, 81.8%, 83.3%, respectively (Fig. 4).
1) IVIM parametrics between different treatment regimen groups
All patients were divided into an IMRT alone group, CCRT, and sequential CRT group (NAC+IMRT). The D values of the primary NPC tumor in patients with different CRT regimens were increased after RT, and D increased more gradually in the NAC+RT group. However, the D* and f values decreased, in which the RT group decreased more significantly. D*25 were significantly different when comparing IMRT alone and CCRT groups (p=0.007). However, the difference in D0, D20, D*0, D*25, and f20 between IMRT alone and NAC+IMRT groups was significant (p=0.004, p=0.015, p=0.031, p=0.006, and p=0.034, respectively).
Discussion
The current study investigated the assessment of treatment responses in NPC by IVIM-DWI. IVIM parametrics including D, f, and D* altered significantly for responders during the course of IMRT. In particular, D and f were more sensitive to assess response in the early course of the treatment, whereas D* revealed changes in later stages.
The bi-exponential model of IVIM demonstrated the heterogeneity of water diffusion and differentiated the contributions from perfusion from diffusion [9,10,20]. Compared to conventional ADC measurement by DWI, IVIM parametrics can simultaneously and separately quantify tissue perfusion and diffusion, and better characterize the pathological features of tumor tissues as well as their response to chemoradiotherapy. Upon radiation therapy, large numbers of tumor cells underwent apoptosis, resulting in a higher degree of fluid migration into the extracellular space (i.e., pure diffusion). Meanwhile, the obstruction of microcirculation became severe, leading to less blood flow in capillary networks (i.e., pseudo-diffusion). Both the cellularity and immature microvessels in tumor tissues decreased dramatically. The overall effect of these pathological events led to a significant increase in D as well as decrease in D*, which were found in our data. Lai et al. [12] reported a similar diffusion perfusion change in residual NPC tumors after RT compared with post-radiation fibrosis. Furthermore, both D and D* were found to be significantly altered in responders relative to non-responders, indicating their potential in predicting the short-term treatment response of NPC [21-25].
Recent studies have employed diffusion MRI to monitor the treatment response of tumors in CRT [21-23]. Our previous study also demonstrated that NPC with a lower baseline D0, which had a higher cellularity, responded better to NAC [16]. Because D composes diffusion in the extracellular and intracellular space, an alteration in D reflected the microstructure changes for the assessment of the treatment response in IMRT. This was consistent with Mardor et al.’s study [24] showing that both ADC and RD (a diffusion index indicates the normalized summation of signal decay) before treatment were closely correlated with tumor radio-sensitivity. Although there were no significant changes in D after the fifth fraction, the D5 of responders was significantly larger than that of non-responders. ROC analysis suggested that D5 could differentiate treatment responses with AUC, sensitivity, and specificity of 0.773, 72.2%, and 90.9%, respectively. Lu et al. [25] also reported that HNSCC patients with a lower standard deviation of pre-treatment D responded better to treatment. Similar, studies also demonstrated the prognostic value of D [16,21-25]. However, perfusion measured by MRI has been used to assess the therapeutic effects and long-term prognosis for patients with malignancies. The perfusion level of tissues was suggested to potentially predict the tumor sensitivity of CRT [26,27]. Lai et al. [12,13] reported that f could effectively distinguish residual tumors of NPC from radiation-related fibrous tissues, as well as tumor stages. HNSCC patients with a smaller perfusion fraction were always accompanied with a low survival rate [22]. Interestingly, our present results showed that responders expressed a smaller baseline f0, a larger f10 and Δf10 relative to non-responders. These may infer the irradiation damages on the integrity of microvascular walls in the early course of IMRT.
D and f were more sensitive in the early course of treatment, whereas D* changes more in later course in responders relative to non-responders. The ROC curve analysis further illustrated that D5, D*20, and f10 better differentiate responders from non-responders. These findings may indicate that the destruction of cell structures by irradiations in radio-sensitive tumors was more predominant early in the treatment, whereas damage to microcirculation was more evident at the later course of radiation. Larocque et al. [28] and Koh [29] both demonstrated that early changes in diffusion parametrics could be used to evaluate the sensitivity of RT and/or chemotherapy. They observed that the average tumor ADC value increased significantly 7 days after irradiation [28] and that the correlation between the decrease in perfusion parametrics (D* and f) and tumor shrinkage 7 days after treatment significantly increased [29]. Hong et al. [8] also suggested ADC to predict the short-term treatment response to RT in NPC. All of the above supported that the IVIM parametrics reflect tumor intrinsic radiosensitivity and biological response.
Additionally, IVIM parametrics could indicate a response of various treatment regimens (i.e., IMRT with or without neoadjuvant or concurrent chemotherapy). D0 of the NAC+IMRT group was significantly larger than IMRT alone and CCRT, whereas D*0 of the NAC+IMRT group was significantly smaller than those of the latter. The D20, f20, and D*25 parametrics between IMRT alone and NAC+IMRT groups were significantly different, whereas D*25 was significantly different between IMRT alone and the CCRT groups. These indicated a significant increase in D and decrease in D* caused by NAC. This could be attributed to a decrease the cellularity and increase extracellular space upon NAC. Additionally, a decrease in tumor perfusion may suggest microcirculation blockage, which in turn influences the oxygen metabolism of tumor cells and the radio-sensitivity of NPC. No significant difference was found in IVIM parametrics between NAC+IMRT and CCRT throughout the course of treatment. This may suggest similar cytotoxic effects on tumor cells between neoadjuvant and concurrent chemotherapy.
To further solidify the evidence presented in this study, additional examinations will be assessed. First, histopathological examinations during radiations were not obtained for ethical reasons. Complementary studies on NPC xenografts are needed to analyze the pathological changes during fractional radiations. Second, the current study only evaluated local control and short-term treatment outcomes of primary NPC tumors, while initial staging (such as WHO grades and nodal or distant metastasis) was not considered between responders and non-responders. Nevertheless, the latest follow-up data indicated that three cases of local and regional relapse and two cases of distant metastases were all found in non-responders rather than responders. In this regard, a prospective study with a prolonged follow-up period to investigate the long-term survival of patients and cancer staging would be possible. Lastly, the sample size of this prospective study was relatively small, which should be expanded.
Compared to non-responders, responders presented significantly larger changes in D and f at the early course of treatment and D* later in the treatment. IVIM-DWI could effectively assess the short-term treatment response to RT and could be recommended to predict the radiosensitivity of NPCs.