1The Korea Central Cancer Registry, Division of Cancer Registration and Surveillance, National Cancer Center, Goyang, Korea.
2National Cancer Control Institute, National Cancer Center, Goyang, Korea.
Correspondence: Sohee Park, PhD. The Korea Central Cancer Registry, Division of Cancer Registration and Surveillance, National Cancer Center, Madu 1-dong, Ilsandong-gu, Goyang 410-769, Korea. Tel: 82-31-920-2015, Fax: 82-31-920-2179, shpark@ncc.re.kr
Received February 22, 2011 Accepted March 03, 2011
This is an Open-Access article distributed under the terms of the Creative Commons Attribution Non-Commercial License (http://creativecommons.org/licenses/by-nc/3.0/) which permits unrestricted non-commercial use, distribution, and reproduction in any medium, provided the original work is properly cited.
Abstract
Purpose
This paper overviews the nationwide cancer statistics including incidence, mortality, survival and prevalence, and their trends in Korea based on the year 2008 cancer incidence data.
Materials and Methods
Incidence data from 1993 to 2008 were obtained from the Korea National Cancer Incidence Database, and the vital status was followed through December 31, 2009. Mortality data from 1983 to 2008 were obtained from the Korea National Statistics Office. Crude rates and age-standardized rates for incidence, mortality, prevalence and relative survival were calculated.
Results
There were 178,816 cancer cases and 68,912 cancer deaths observed during year 2008 and 724,663 10-year cancer prevalent cases as of January 1, 2009 in Korea. The incidence rate for all cancer combined showed an annual increase of 3.1% from 1999 to 2008.
Conclusion
With significantly increasing cancer incidence, Korea faces a large cancer burden and efficient cancer control programs are essential.
Cancer has been the leading cause of death in Korea since 1983 [1] and has drawn much attention in public health. Over 170,000 new cancer cases are diagnosed annually in Korea and one out of four deaths results from cancer [2,3]. This paper gives an overview of the nationwide cancer statistics, including the incidence, mortality, prevalence, survival rates and their trends in Korea.
1. Data sources
The Ministry of Health and Welfare, Korea had initiated a nationwide hospital-based cancer registry as early as 1980 called the Korea Central Cancer Registry (KCCR). The registry collected approximately 80-90% cancer cases from more than 150 training hospitals across the country every year. From 1999, the KCCR expanded cancer registration to cover the whole population under the Population-Based Regional Cancer Registry (PB-RCR) program. Details of the history, objectives, and activities of the KCCR have been documented [4]. Incidence data from 1999 to 2008 were obtained from the Korea National Cancer Incidence Database (KNCI DB). Cancer cases were classified according to the International Classification of Diseases for Oncology 3rd edition [5] and converted according to the International Classification of Diseases 10th edition (ICD-10) [6]. The survival analysis used 1,623,046 cancer cases first diagnosed during 1993-2008 from the KNCI DB, and followed the vital status through 31 December 2009.
Mortality data from 1983 to 2008 were obtained from the Korea National Statistics Office (KNSO) [1]. Cause of death was coded and classified according to the ICD-10. The population data were also obtained from KNSO using the resident registration population on July 1st of specified years.
Analysis
Crude rates (CRs) and age-specific rates of cancer incidence and mortality were calculated. Age-standardized rates (ASRs) were determined using the World Health Organization (WHO) world standard population [7]. The cumulative risks of cancer incidence, which represent the probability of developing cancer to life expectancy, were also calculated. Changes in the annual age-standardized cancer incidence rates were examined by calculating the annual percentage change over a time period as (exp(b)-1)x100, where b is the slope of the regression of log ASR on a calendar year [8].
In order to assess the level of cancer burden, prevalence was also estimated which represents new and pre-existing cancer cases diagnosed during a given period of time and still alive on an index date. Using the cancer incidence database from 1999 to 2008, we calculated the limited-duration prevalence, such as 1, 5, and 10-year prevalence. In this study, for example, 10-year prevalence was calculated from the number of people alive on January 1, 2009 who were diagnosed with cancer within the previous 10 years. We applied the counting method using SEER*Stat software [9] to calculate the number of prevalent cases while adjusting for the patients lost in follow-up [8].
The survival duration of each case was determined as the time difference between the date of initial diagnosis and the date of death, date of loss to follow-up, or closing date for follow-up. Observed survival rates were calculated using a life table method and relative survival rates were examined with the Ederer II method [10] using an algorithm written in SAS by Dickman [11], with some minor modifications.
Selected Findings
1. Incidence
Table 1 presents the overall number of cancer incident cases, deaths and prevalent cases during 2008 in Korea by sex and cancer site. In 2008, 178,816 cancer incident cases and 68,912 deaths were observed in Korea. As of January 1, 2009, there were 724,663 10-year cancer prevalent cases observed in Korea. The cumulative risks for developing cancer to the life expectancy were 37.2% for men and 30.5 for women in 2008.
Table 2 shows the cancer incidence rates by sex in 2008. The CRs of all sites combined in 2008 were 375.7 and 348.1 per 100,000 in men and women, respectively. The ASRs of all sites combined were 318.5 and 245.3 per 100,000 in men and women, respectively. In males, the five leading primary sites of cancer were the stomach (CR, 76.3; ASR, 63.8), colon and rectum (CR, 54.7; ASR, 45.9), lung (CR, 54.1; ASR, 46.9), liver (CR, 47.6; ASR, 38.9), and prostate (CR, 26.1; ASR, 23.0), accounting for 68.9% of all newly diagnosed cancers in 2008. In females, the most common cancer sites were the thyroid (CR, 91.9; ASR, 68.6), breast (CR, 51.1; ASR, 36.8), stomach (CR, 37.2; ASR, 24.9), colon and rectum (CR, 36.9; ASR, 24.7), lung (CR, 21.9; ASR, 13.9), and cervix uteri (CR, 15.8; ASR, 11.2), accounting for 73.2% of all newly diagnosed cancers. Thyroid cancer alone accounted for 26.4% (22,648) of incident cases in women in 2008.
2. Mortality
There were 68,912 cancer deaths reported in Korea during 2008, accounting for 28.0% of all deaths (Table 3). In 2008, The CRs of all sites combined were 176.9 and 101.9 per 100,000 for men and women, respectively. The ASRs of all sites combined were 154.1 and 63.5 per 100,000 for men and women, respectively. Cancers of the lung, liver, stomach and colon and rectum were the most common fatal cancers, which accounted for about 62.7% of all cancer deaths in 2008 (Table 4).
In men, the five leading primary cancer sites for mortality in 2008 were the lung (CR, 44.0; ASR, 38.7), liver (CR, 34.4; ASR, 28.5), stomach (CR, 27.1; ASR, 23.5), colon and rectum (CR, 15.4; ASR, 13.5), and pancreas (CR, 8.6; ASR, 7.5). In women, lung cancer mortality (CR, 15.8; ASR, 9.4) increased gradually being the first cancer site for mortality in 2008, followed by stomach (CR, 14.6; ASR, 8.7), colon and rectum (CR, 12.1; ASR, 7.3), liver (CR, 11.3; ASR, 7.2), and gallbladder (CR, 7.1; ASR, 4.1).
3. Trends in cancer incidence
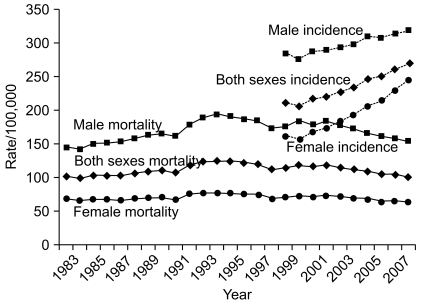
Tables 5-7 present the cancer incidence rates during 1999-2008 in Korea for all sites combined and for selected cancer sites. The incidence rate for all sites combined increased by 3.1% annually from 1999 to 2008. The incidence rate for all sites combined increased by 1.5% annually in men and by 5.1% in women from 1999 to 2008. The rapid increase in cancer incidence is also illustrated in Fig. 1.
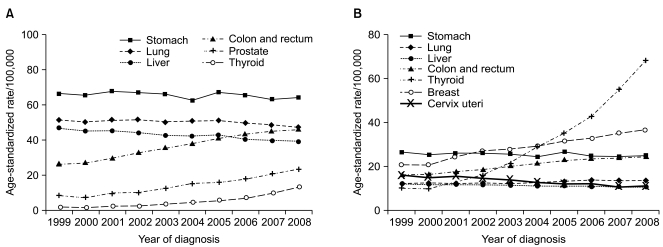
As shown in Fig. 2, the incidence rates have continued to increase for colon and rectum and thyroid cancer in both sexes, along with breast cancer in females and prostate cancer in males. On the contrary, the incidences of liver cancer in both sexes and cervix cancer in women have decreased. Stomach cancer incidence rates remained the same in men and women. One notable aspect was the sharp increase (25.4% annually) in the incidence of female thyroid cancer. As diagnostic techniques for thyroid cancer have become more sensitive, such as with the advent of ultrasound and fine-needle aspiration, the detection of subclinical disease has become possible. Therefore, the increased incidence of thyroid cancer may reflect improved diagnostic techniques for previously undetected disease, rather than a true increase in the occurrence of thyroid cancer [12,13]. Furthermore, from the construction of a KNCI DB for 1999 onward to 2008, the completeness of the Korea cancer registry data has improved gradually. This might have contributed in part to the gradual overall increase in cancer incidence, especially among the elderly.
4. Age-specific incidence rates for selected cancer sites
Table 8 presents the most common cancer sites by sex and age group in 2008. Leukemia and thyroid were the most common forms in both sexes, for ages 0-14 and 15-34 years, respectively. For males, stomach cancer was the most common in 35-64-year-olds, while lung cancer was more frequent for patients aged 65 and over. Thyroid cancer was the most common site for mid-aged Korean women (35-64-year-olds), and colorectal cancer was the most common among old aged women (≥65 year-olds).
Fig. 3 shows the age-specific incidence rates of the selected cancers for men and women in 2008. The data show that the incidence of stomach, lung, liver and colorectal cancers increased gradually with age. Female breast and thyroid cancers showed highest incidence rates for women in their late forties and early fifties, respectively, and then leveled off. This pattern is very different from the rates observed in Western countries [14].
5. Trends in cancer mortality
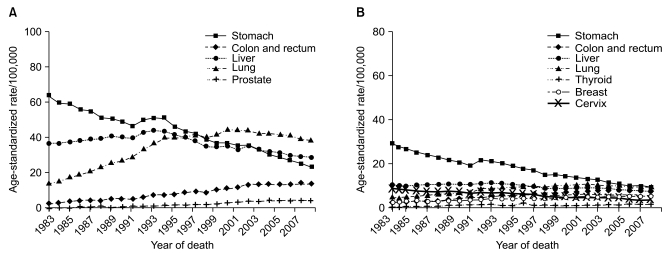
Figs. 1 and 4 show the trends in cancer deaths for all sites combined and for selected cancer sites. Age-standardized mortality rates have decreased for all sites combined in both sexes since 2002. Lung cancer surpassed stomach cancer as the leading cause of cancer death in 1999, and is expected to account for 21.5% of all cancer deaths in 2008. The age-standardized mortality rates of lung have decreased slightly for men since 2001, but increased in women. The age-standardized mortality rates of stomach and cervix uteri cancer have decreased continuously. Along with the significant increases in colorectal, prostate and female breast cancer incidence, the mortality rates of these cancers have also continued to increase.
6. Survival rates
Table 9 shows the 5-year relative survivals for four periods of diagnosis time: 1993-1995, 1996-2000, 2001-2005 and 2004-2008. Cancer patients that were diagnosed in the recent period (2004-2008) had 5-year relative survival rates of 59.5% for all sites combined in both sexes, 50.8% in males and 69.2% in females. When compared with earlier periods, notable improvements have been observed in the 5-year relative survival rates for all sites combined. Observation of higher female cancer survival rates than male cancer survival rates may be partly explained by common female cancers (e.g., thyroid, breast, and uterine cervix) that are known to have relatively good prognoses.
When examined by the year of diagnosis and cancer site, the 5-year relative survival rates appeared to be higher for most major cancer sites in patients diagnosed during 2004-2008 compared to 1993-1995, except for pancreatic cancer. The greatest improvements were seen in prostate, stomach, leukemia, and non-Hodgkin lymphoma. The improving survival rates could be attributable to early detection, as well as to improved treatments [15,16], but this needs to be evaluated further. Lack of progress in early detection and treatment could explain the observed absence of improvement in the survival rate of pancreatic cancer [17].
7. Prevalence rates
Table 10 shows the 10-year cancer prevalent rates on January 1, 2009 in Korea by sex and cancer site. The 10-year cancer prevalence CRs of all sites combined were 1,350.4 and 1,583.7 per 100,000 in men and women, respectively, and the 10-year cancer prevalence ASRs of all sites combined were 1,145.0 and 1,136.2 per 100,000 in men and women, respectively. In males, the five leading primary sites of cancer for prevalence were the stomach (CR, 362.0; ASR, 302.0), colon and rectum (CR, 244.2; ASR, 206.1), liver (CR, 109.4; ASR, 90.2), prostate (CR, 96.7; ASR, 86.3), and lung (CR, 94.8; ASR, 81.1), accounting for 67.2% of all cancer prevalent cases. In females, the most common cancer sites were the thyroid (CR, 375.1; ASR, 277.7), breast (CR, 320.9; ASR, 232.2), stomach (CR, 183.0; ASR, 123.6), colon and rectum (CR, 172.8; ASR, 115.8), cervix uteri (CR, 134.3; ASR, 95.1), and lung (CR, 46.5; ASR, 31.2), accounting for 77.8% of all cancer prevalent cases.
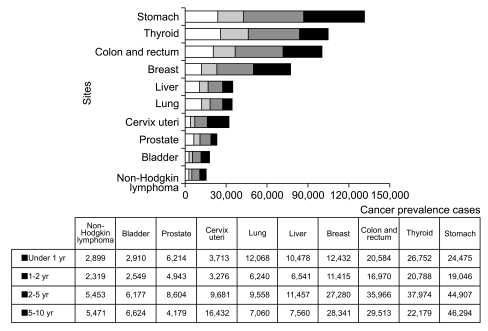
Fig. 5 shows the prevalence by time since diagnosis. For all cancers combined, the 1- to 2-year prevalence represented 37% of the total prevalent cases. The 1- to 2-year prevalence as a percentage of the total was highest for thyroid cancer (18%) following stomach (16%), and colorectal cancer (14%), which has high incidence rates and a good prognosis. For all cancers combined, the 2- to 5-year prevalence and the 5- to 10-year prevalence constituted 33% and 30% of the total prevalence in both sexes, respectively. The long-term prevalence of lung and liver cancer was relatively low due to lower rates of survival.
Acknowledgments
The authors thank the Korea Central Cancer Registry (KCCR)-affiliated Hospitals, non KCCR-affiliated Hospitals, 11 Regional Cancer Registries (Busan, Daegu & Gyeongbuk, Gwangju & Jeonnam, Incheon, Daejeon & Chungnam, Ulsan, Gangwon, Chungbuk, Jeonbuk, Gyeongnam, and Jejudo), the National Health Insurance Corporation, and the National Statistical Office for data collection.
This work was supported by a research grant from the National Cancer Center (No. 1010160), and the National Health Promotion Program grant (No. 1060300) from the Ministry of Health and Welfare, Republic of Korea.
Conflicts of Interest
Conflict of interest relevant to this article was not reported.
References
1. National Statistical Office, 2009 [Internet]. 2009. cited 2011 Jan 14Daejeon: National Statistical Office; Available from: http://kostat.go.kr
2. Ministry for Heath, Welfare and Family AffairsAnnual report of cancer incidence (2006) and survival (1993-2006) in Korea. 2009. Seoul: Ministry for Heath, Welfare and Family Affairs.
3. Won YJ, Sung J, Jung KW, Kong HJ, Park S, Shin HR, et al. Nationwide cancer incidence in Korea, 2003-2005. Cancer Res Treat. 2009;41:122–131. PMID: 19809561
4. Shin HR, Won YJ, Jung KW, Kong HJ, Yim SH, Lee JK, et al. Nationwide cancer incidence in Korea, 1999~2001; first result using the national cancer incidence database. Cancer Res Treat. 2005;37:325–331. PMID: 19956367
5. Fritz A, Percy C, Jack A, Shanmugaratnam K, Sobin L, Parkin DM, et al. International classification of diseases for oncology. 2000. 3rd edGeneva: World Health Organization.
6. World Health OrganizationManual of the international statistical classification of diseases, injuries, and causes of death. 1992. 10th revGeneva: World Health Organization.
7. Segi M. Cancer mortality for selected sites in 24 countries (1950-1957). 1960. Sendai: Tohoku University School of Medicine.
8. Altekruse SF, Kosary CL, Krapcho M, Neyman N, Aminou R, Waldron W. SEER cancer statistics review, 1975-2007. 2010. Bethesda, MD: National Cancer Institute.
9. SEER*Stat Program, version 6.6.1 [Internet]. National Cancer Institute. 2011. cited 2011 Jan 14Bethsda, MD: National Cancer Institute; Available from: http://seer.cancer.gov/seerstat/
10. Ederer F, Heise H. Instructions to IBM programmers in processing survival computations. Methodological note No. 10. 1959. Bethesda, MD: National Cancer Institute.
11. Dickman P [Internet]. cited 2009 Apr 14Stockholm: PaulDickman.com; Available from: http//www.pauldickman.com
12. Davies L, Welch HG. Increasing incidence of thyroid cancer in the United States, 1973-2002. JAMA. 2006;295:2164–2167. PMID: 16684987
13. Enewold L, Zhu K, Ron E, Marrogi AJ, Stojadinovic A, Peoples GE, et al. Rising thyroid cancer incidence in the United States by demographic and tumor characteristics, 1980-2005. Cancer Epidemiol Biomarkers Prev. 2009;18:784–791. PMID: 19240234
14. Curado MP, Edwards B, Shin HR, Stom H, Ferlay J, Heanue M. Cancer incidence in five continents. 2007. vol.9. Lyon: IARC.
15. Jung KW, Yim SH, Kong HJ, Hwang SY, Won YJ, Lee JK, et al. Cancer survival in Korea 1993-2002: a population-based study. J Korean Med Sci. 2007;22(Suppl):S5–S10. PMID: 17923755
16. Gondos A, Bray F, Hakulinen T, Brenner H. Trends in cancer survival in 11 European populations from 1990 to 2009: a model-based analysis. Ann Oncol. 2009;20:564–573. PMID: 19066327
17. Dickman PW, Adami HO. Interpreting trends in cancer patient survival. J Intern Med. 2006;260:103–117. PMID: 16882274
Fig. 1
Annual age-standardized cancer incidence and death rates for all sites by sex during 1983-2008 in Korea. Age-standardization was based on the World Health Organization (WHO) world standard population.
Fig. 2
Trend of age-standardized cancer incidence for selected cancers by sex during 1999-2008 in Korea. Age-standardization was based on the World Health Organization (WHO) world standard population. (A) Male. (B) Female.
Fig. 3
Age-specific incidence rates of major cancers during 2008 in Korea. (A) Male. (B) Female.
Fig. 4
Annual age-standardized cancer mortality for selected cancers by sex during 1983-2008 in Korea. Age-standardization was based on the World Health Organization (WHO) world standard population. (A) Male. (B) Female.
Fig. 5
Number of prevalent cases by time since diagnosis for major cancer sites on January 1, 2009 in Korea.
Table 1
Number of cancer incidence cases, deaths, and prevalent cases by sex during 2008 in Korea
CNS, central nervous system. a)10-yr prevalent cases: limited-duration prevalent cases on January 1, 2009. These are patients that were diagnosed between January 1, 1999 and December 31, 2008 and were alive on January 1, 2009. Multiple primary cancer cases were counted multiple times, b)Includes gallbladder and other/unspecified parts of biliary tract.
Table 2
Crude and age-standardized cancer mortality rates by sex during 2008 in Korea
CNS, central nervous system. a)Age adjusted to the World Health Organization (WHO) world standard population, b)Includes gallbladder and other/unspecified parts of biliary tract.
CNS, central nervous system. a)Age adjusted to the World Health Organization (WHO) world standard population, b)Includes gallbladder and other/unspecified parts of biliary tract.
Table 5
Trends in cancer incidence rates in both sexes during 1999-2008 in Korea
CNS, central nervous system. a)Annual percent change (APC) using age-standardized incidence based on the World Health Organization (WHO) world standard population, b)The APC is significantly different from zero (p<0.05), c)Includes gallbladder and other/unspecified parts of biliary tract.
Table 6
Trends in cancer incidence rates in males during 1999-2008 in Korea
CNS, central nervous system. a)Annual percent change (APC) using age-standardized incidence based on the World Health Organization (WHO) world standard population, b)The APC is significantly different from zero (p<0.05), c)Includes gallbladder and other/unspecified parts of biliary tract
Table 7
Trends in cancer incidence rates in females during 1999-2008 in Korea
CNS, central nervous system. a)Annual percent change (APC) using age-standardized incidence based on the World Health Organization (WHO) world standard population, b)The APC is significantly different from zero (p<0.05), c)Includes gallbladder and other/unspecified parts of biliary tract.
Table 8
Five major sites of cancer incidence by age group and sex during 2008 in Korea
CNS, central nervous system. a)Change in the 5-yr relative survival between 1993-1995 and 2004-2008 as a percentage, b)Includes gallbladder and other/unspecified parts of biliary tract.
Table 10
Crude and age-standardized cancer 10-yr prevalent rates on January 1, 2009 by sex during 2008 in Korea
CNS, central nervous system. a)Adjusted to the World Health Organization (WHO) world standard population, b)Includes gallbladder and other/unspecified parts of biliary tract.